Creating DSMs DTMs and Orthomosaics in WebODM From Drone Images
Contents
Purpose
The purpose of this tutorial is to teach the user how to use WebODM, in order to create surface models and orthomosaics from a provided data set of photos taken with a consumer drone.
Introduction
What is WebODM, and why would you use it?
WebODM (standing for Open Drone Map) is an open-source software package with a graphical user interface that allows users to process remotely sensed data from drones into various types of outputs. WebODM allows the user to process RGB colour images, or multispectral images into outputs including: DSMs, DTMs, pointclouds, orthomosaics, and other formats. The software allows for the use of ground control points, and rolling shutter correction. For more information, visit the WebODM website here: https://www.opendronemap.org/webodm/. In this tutorial we will be learning how to install and use this software with a sample set of RGB drone images to create a DSM, DTM and orthomosaic. We will also have the software output an accuracy report.
Step 1: Installation
Before we begin the installation process, please note that this tutorial assumes the user is using a modern computer, with a discrete GPU. The tutorial was created and tested running on a windows professional system, thus the process may not work fully for Linux and Mac OS users.
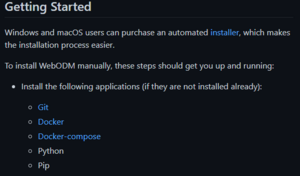
To begin the install, go to the link here: https://github.com/OpenDroneMap/WebODM/ and scroll down to the “Getting Started” section as seen in figure 1. This tutorial assumes that the user already has python installed. Neither Docker-Compose, nor Pip are necessary for our purposes.
1a: Git
To begin the Git installation process, click on the blue hyperlinked Git text shown in figure 1. Select your operating system and download the “standalone installer” not the “portable” version. Open the file download location and run the Git installer. There will be several options and pages during the install of Git, leave all the options in their default state, and click next through the menus without modifying any options until the program begins installing, this will take a minute once it begins. Once you get to the final page after install, click finish. Git is now installed on your machine.
1b: Docker 2.2.0.5
Before beginning the installation of Docker, ensure that virtualization is enabled on your machine if it is not already. This can be done in your computer’s BIOS settings, and the process to enable it varies depending on your hardware. Docker is essentially a virtual machine that we will use to run WebODM, and we will then access it through a web browser window. To begin the installation of Docker, click here: https://docs.docker.com/desktop/previous-versions/2.x-windows/ . Scroll down to reach the download link for Docker version 2.2.0.5. We will be using this version as it allows us to more easily control the resources we allocate to Docker in terms of memory, CPU threads, and storage. Once you have downloaded this version of Docker, open the installer and proceed through the installation, leaving all the settings default once again. Once this process is finished, run docker if it is not already running (note: it can take a while to start up, and this can be monitored in your windows “hidden icons” tab at the bottom right hand corner of the windows dashboard. Once you have Docker open, you will notice that it says “No containers running” this is where WebODM will show up once we complete the next step of the tutorial.
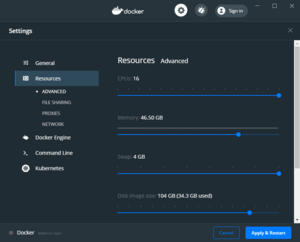
To chose your resource allocation for Docker, click the cog wheel in the upper bar of the window, and on the left hand side, navigate to the resources tab. In this tab, you will want to allocate as much memory and CPU threads as you can, as well as maxing out the “Swap” slider. For disk image size, this is up to you, depending on how many projects you intend to keep in your WebODM image. For this tutorial, allocate at least 30GB to be safe. Please note that the more CPU threads and memory you allocate to Docker, the less your main system will have access to while WebODM is running. Click to apply your settings, and Docker will restart (again this make take some time). If you’ve allocated too much memory, Docker will not start, if this happens, navigate back to the resources menu to lower the memory allocation and try again.
1c: WebODM
To complete this last step of installation, Docker must already be running properly. In your windows search menu, type in “Git Bash”. This command line tool was installed when we installed Git. Right click on it and click run as administrator. Follow the prompt and say yes to give it permission. The Git Bash command terminal should now be open in its own window. We will now type in some commands, you can either type them out or exactly as shown below, or copy and paste them into Git Bash. Firstly type:
git clone https://github.com/OpenDroneMap/WebODM --config core.autocrlf=input --depth 1
wait until the purple command prompt re appears, then type:
cd WebODM
Lastly type in:
./webodm.sh start
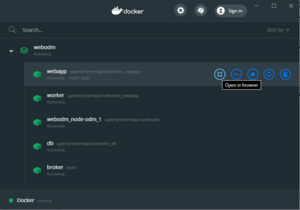
After typing the last command, you will see a lot of text scrolling by, indicating that WebODM is being set up for you in Docker. Wait until you see WebODM running in the docker dashboard. Once you do see WebODM in Docker, then click the drop down arrow, and navigate to the “open in browser” link as shown in Figure 3. This completes the installation phase of the tutorial.
Step 2: Download the Data
To download the data click here: https://drive.google.com/file/d/12umZHwdEU_ur7oFi1E1pV0t9yR3ClM8X/view?usp=share_link and download the zipped folder which contains a series of images, and a .txt document describing how and where they were collected. Unzip the folder and keep it accessible for when we open WebODM.
Step 3: Using WebODM
To begin with WebODM, once you have it open in your browser, create an account name and password. This information is used only to log in to the software running on your local machine, so make it as simple as you like.
3a: Importing the data
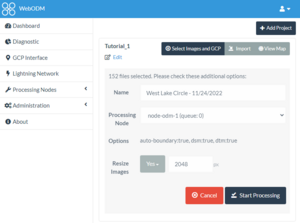
To begin with a new project in Web ODM, select “dashboard” from the menu on the left hand side of the page. Then, in the top right hand corner, click add project. You can name this project as you see fit. Once you have created a new project, click “Select Images and GCP”. Since we are not using any GCPs for this tutorial, you can ignore that portion. Navigate to the folder containing the images that you previously downloaded and select all of the .jpeg files, making sure not to include the text file, as this will cause issues for the software.
3b: Settings selection and Running the Software
Now that you have your data selected, we will go through the proper settings to be able to create a DSM, DTM and orthomosaic, as well as a .pdf report on the output results. Under Options, click “DSM + DTM”. Under resize images, click yes, and type 2048 for the px (pixel) count. Enabling this option will greatly reduce the processing time and the memory required, however it will reduce the resolution of the final outputs slightly. If your machine is old, or does not have a lot of memory, you can try going to the Edit menu, next to options and select “fast orthophoto” and “pc – tile”.
Once your options are selected, click on the “Review” button, then click “Start Processing”. Depending on your machine, this could take anywhere form a half hour, to several hours to complete, be patient. The green progress bar does not move linearly, and can seem stuck early in the process, however once it begins to move near the middle, it will be almost complete.
3c: Viewing and Downloading Your Outputs
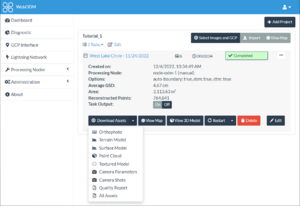
Firstly, we will start by downloading all of the assets we produced, including a DSM, a DTM, an orthomosaic, and the automatically generated report. To do this, we will click on the “Download Assets” button, and select “All Assets”. This will begin a download from the virtual machine, to your host OS download folder. The download will be a zipped file, containing all of the assets previously discussed.
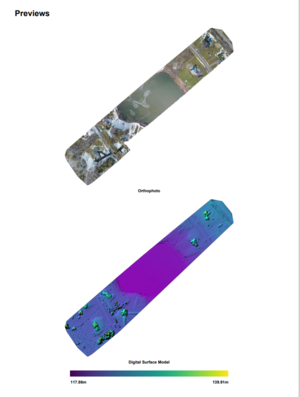
To view your outputs in WebODM, click on the “View Map” button. Once this page opens, it will default to showing the orthomosaic overlaying a satellite image of the area. To view the DSM or DTM, you will notice there are tabs at the top right hand corner of the page. You will be able to pan and zoom on these assets, as well as perform basic distance, area, and volume calculations using the toolbar on the right hand side of the frame. On the right hand side you will also find a contour lines tool, and a tool for changing the basemap.
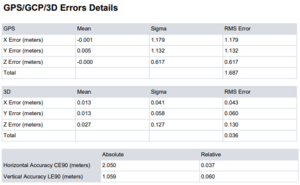
In the zipped folder that you downloaded previously which contains all of the assets, open the file ending in “report.pdf” to view a summary and accuracy assessment of your outputs. In figure 6 as shown below, you will be able to see the calculated horizontal, and vertical absolute and relative accuracy figures.
Conclusion: What's next? How are These Outputs Useful?
Congratulations! You have successfully used WebODM to turn a series of photos captured by a drone into multiple useful assets that can be imported into other GIS software. These .tiff files for the DSM, DTM and orthomosaic can be brought in to other software like QGIS, ArcGIS, and many others for use as a basemap, or for further analysis, categorization, measurement, and production of standalone or webmaps. They can be used the same as any other files of this type that you have previously worked with.
One thing to note is that this dataset is not very accurate in terms of its absolute accuracy. To improve this, ground control points can be added using WebODM, or images taken from a drone with an RTK module could be used in order to improve accuracy.
