Creating Service Areas in QGIS: Comparing QGIS network analyst and Valhalla plugin
Contents
Introduction
In this tutorial we will be creating service areas for parks in Ottawa using two different tools. The tools we will be comparing are the QGIS network analysis tool and the Valhalla plugin these both do similar things while using different methods to create an output. Service areas can be useful to determine accessibility to an establishment and can help determine which areas are not currently able to attend the establishment within a reasonable amount of time or within in a reasonable distance. For this tutorial we will create a service area for a 10 minute walk from parks and service areas for a 5, 10 and 15 minute walk from parks in Ottawa. These times were picked as parks are most often attended by children in the surrounding area and more then a fifteen minute walk one way would likely be outside of the neighbourhood. The output from this tutorial could easily be used to determine areas in need of a park or a layer to a multi-criteria analysis determining areas in need of a park
From this tutorial you will learn how to input data into QIS, set projections, edit files, set symbology, download plugins, use QGIS network analyst to create service areas, and use Valhalla toolbox to create service areas.
Data
Finding and downloading data
For this tutorial we will be using only open data and open sourced programs. You will need to have QGIS installed to perform this tutorial. All data will come from Open Ottawa Catalogue. The files you will need for this tutorial are: road-centerlines play-area-structures ottawa-neighbourhood-study-ons-neighbourhood-boundaries-gen-2.
To download these files select down load or the symbol that looks like a cloud with a down arrow in it. This will open several options of formats to download the files in. You should select Shapefile.
Once all the data is downloaded create a folder in you computer to move all your data files to. Name this new folder something relevant to the tutorial so it is easy to find like NetworkAnalysis_ServiceAreasTutorial. This is to ensure you can easily all the files needed.
Uploading data into QGIS
To add the data in to QSIS go to the Layer tab at the top of the program select Add Layer > Add Vector Layer. This will open a menu called Data Source Manager| Vector. In this menu click the three dots symbol to browse your computer and find the files that were downloaded in the previous step. Select the Play_Area_-_Structures folder and then select the .shp file in that folder. Click Open. After this select Add at the bottom of the menu. Do this for the rest of the files downloaded in the previous step.

Setting projections
To be able to do some of the network analysis we will be doing in this tutorial we will need to have our data and project CRS set to a projected coordinate system.
At the bottom right corner of the screen you will see a little earth looking icon with EPSG:4326.Click this icon to set the map CRS. In the search bar of the menu that opens search 32618. Then select WGS 84/ UTM zone 18N which should appear in the predefined coordinate reference systems section. Then select Ok.
To change the projections in the projection tool bar click vector general and select reproject layer. Under the input later title select one of the files and in target CRS select project CRS from the drop down menu. Then under reprojected click the three dots to open your file explorer. Save the file in the project folder created earlier in the tutorial and give the file a unique name. Then select save and in the menu select run. Repeat this step with all of the files.
Part 1: QGIS Network analyst tool
QGIS has now created its own set of network analyst tools within the program. This tool can calculate routes and service areas from a singular point or layer based on distance or time. This tool uses your own network that you will need to put into the map and has some advanced parameters you can set like travel speed, road direction and topology tolerance. If in the attributes of the network you have fields that dictate the speed limits for different roads or which direction is allowed on the road you are able to set them in the advanced parameters as well.
Creating Service Areas Using Qgis Network Analyst Tools
Editing Network
To begin this tutorial we must edit our Roads that we will be using as our network. Unfortunately, there are not well connected pedestrian networks available for Ottawa so we will be using a street centerline file as our network and will delete any roadways that pedestrians cannot walk on.
First we will open the Select Features menu. In the third tool bar from the top, the second symbol in click the small down arrow beside the symbol and select Select Features. In the menu that open in the section called sub class change the drop down menu to the right to Equal to. Then in the Subclass section type Freeway and then at the bottom of the menu click select feature. Repeat this but with putting Ramp, Highway, Parkway, Transitway, and then Busonly. Between typing each subclass into the Subclass section click the the arrow beside select feature and click add to current selection. This will select all the road ways that are most likely not walkable.
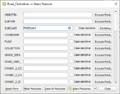
Select Features Menu

To delete these selected roads right click on the Road Centerlines file in the layers menu on the left side of the screen and select Open Attribute Table. Then at the top of the attribute table click the pencil icon. This will turn on editing. After you click the pencil click the little red trash can. This is the delete selected features button. Finally click the pencil button again and save the changes you have just made
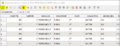
Editing Attribute Table
Using QGIS Network Analyst tool
You will be able to find the Network analyst tool in the processing tool box. If you do not have the processing tool box open go to the processing tab and click Toolbox. Once you find the Network analyst tab click it and then select Service Area (from layer).

In the menu for Service Area (from layer) under vector layer representing network select the projected road center lines file. Under path type to calculate select fastest and for vector layer with start point select the projected Play_Area_-_Structures file. Travel time in this menu is in hours. In this section put 0.167, this is 10 minutes in hours. Then under advanced parameters under default speed (km/h) we will want to set a speed that is an average speed for walking. For this section set the speed to 5 km/h this is because this is the average walking speed used in the plug in tool we will be using later on. Lastly at the bottom of the menu first three dot icon to save the service area, name the file and select save. Then select the other three dot icon select save to file, name and select save. In the menu select Run.
Service Area (From layer) Menu

This will create service area lines along the network according to the parameters put into the menu.
Creating Geometry for the Service Areas
Right now the service area file created is in points and lines which does not really show the full area being serviced by the parks. Using the tool convex hull we will create geometry for these service area lines.
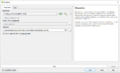
In the Processing tool box under Vector Geometry select convex hull. in the menu for the input layer select the service area lines we created in the previous step. Then select the three dots beside convex hulls to save the file. Then select Run. This will give you polygons around each of the park points.
10 min walk Park Service Areas

Right now all the polygon service areas are overlapping making them hard to distinguish. To make the service areas clearer and more refined by dissolving the touching service areas into each other. In the processing tool bar go to Vector Geometry > Dissolve. In the menu that opens select your new park service area polygons you just made. Then in the Dissolve field(s) field click the three dots, check off type and then OK. In the Dissolved section click the three dots and select save to file, name your new file and click save. Select Run.
Dissolve menu

The output file from doing this will be the final 10 minute service areas as polygon for the parks in Ottawa.
Finalized Service Areas
In the finalized service areas you have created all touching polygons should now be dissolved into one another and look like the image below.
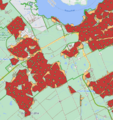
10 minute walk service areas for Ottawa parks

Part 2: Valhalla Network Analyst tool
Valhalla is a free plugin tool for QGIS that preforms several different types of network analysis like calculating routes, isochrones and matrices for automobiles, bikes and pedestrians. This tool uses routing tiles to create the network. These are open sourced cut sections of geographies so it takes less memory to run Valhalla tool. To read more about this check out Valhalla Routing Tiles. It also uses dynamic costing to calculate its routes, isochrones and matrices. This means that it considers more than just strict shortest time or distance but the path with the lowest cost. For example on bike routes or pedestrian routes paths with high elevation have a higher cost as it would be more difficult than a flat path or on path edges that may be an intersection takes the turn type into consideration as a left turn may take longer to do than a right turn. You can also adjust the cost to certain elements in the advanced parameter section when performing one of these analysis. To read more about this check out the Valhalla website Valhalla dynamic costing. It also takes into account speed limits and average travel speeds for pedestrian and bicycles.
Plugins
Downloading the plugins
To start this section of the tutorial you will first need to install two plugins. To do this you will go to Plugins tab at the top of the QGIS program and select manage and install plugins. In the search bar of the menu that opens type in QucikMapServices and select install. This plug in will allow us to put a base map of the city into our map. Then in the same menu search for Valhalla and install this plugin as well.
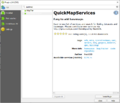
QuickMapServices Plugin
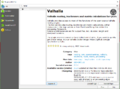
Valhalla Plugin


Creating Service Areas Using Valhalla
Creating a mapbox account and and API key
Before you will be able to use this tool you must create a mapbox account to obtain an API tool. To create an account go to Mapbox and select sign up at the top of the page. Once you create and account and log in it will take you to a page that at the bottom will have a box that say "Access token". Select Create a token.
Creating a Token
In the page you are taken to you will see you must create a name for your token. You may call this whatever you like. For example call it Tutorial.
After you create your token copy it by clicking the small clipboard symbol beside it and go back to QGIS.
Inputting API key
You must input your token to run any Valhalla tools. This is just to keep track of who is using the tool. To do this you must select the Web tab go to Valhalla and then click Valhalla. In the menu that opens click the gear looking symbol. This will open a menu called Provider Settings. In this menu select Mapbox, which should be the second option in the menu, and past your token into the section that says API Key and click OK. You may now close the Valhalla menu you have open
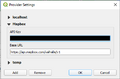
Provider Settings Menu

Using Valhalla tools
To open the Valhalla tool go to the processing tab and select tool box (you can skip this step if you already have the tool box open). You should now be able to scroll to find Valhalla or you can search for it at the top of the processing tool box.
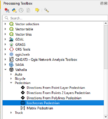
Processing Toolbox

In this tutorial we will be creating service areas for walking distances so click Valhalla > Pedestrian > Isochrones Pedestrian in the processing tool box. In the Isochrones Pedestrian menu that opens select Mapbox in the Provider section. Then in the input point layer section select Play_Area_-_Structures file. In Mode select Fastest because we will be looking at time intervals instead of distance intervals. Lastly in the Comma-separated time internals [Min] section put 5, 10, 15 and make sure to leave the Comma-Separated distance intervals [km] blank. This will give us three intervals for each point for just out time intervals we put in. (This tool does have a glitch that if you have mode set to fastest and are putting in distance intervals it will put the units as minutes instead of km in the output). You will not have to set any of the advanced parameters for this tutorial as Valhalla already has appropriate defaults for them. For example walking speed will be 5.1 km/h if you do not set anything in this parameter.
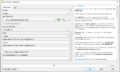
Valhalla Isochrones Pedestrian menu

The output you get from this should be automatically added into your map. You will see that it has a symbol beside its name. This is because this is only a temporary file as there is not a way to set it to save somewhere in the tool. To make this a permanent file in the layers section, right click on the file name and select make permanent. Then in the menu that opens click the 3 dots this will open your file explorer. Go to the folder you made at the beginning of the tutorial with you files in it and then name the file and click save and then click OK in the menu.
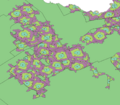
5, 10, 15 min walk parks service areas

Refining Results
Right now the service areas created are hard to see as they are all overlapping and it is diificult to clearly see all three intervals made. Because of this we are going to dissolve over lapping layers at the same intervals into each other.
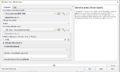
To do this, in the processing tool bar go to Vector Geometry > Dissolve. in the menu that opens select your service area file you just made. Then in the Dissolve field(s) field click the three dots, check off contour and then OK. in the Dissolved section click the three dots and select save to file, name your new file and click save. Select Run.
Dissolve Menu
Troubleshooting Invalid Geometries
It is likely you will receive and error message that says Feature 3996 has invalid geometry. Do not worry if this happens it is an easy fix. Under vector geometry in the processing tool bar find Fix geometries. In the input section select your service areas file and under fixed geometries click the three dots, select save to file, name the file and click save. Then select run. With this new file you should be able to repeat the steps above to dissolve the interval areas without anymore errors.
Set Symbology
Now we will have to set the symbology of the new dissolved service area file created as currently the area are all the same colour. Right click on file and select properties. In the Layer Properties menu that opens select symbology from the list on the left side. Click where it says single symbol and select categorized. In the value section select contour and at the bottom of the menu click classify. This will separate the areas created by their travel intervals. In the colour ramp section you can select the method you want the intervals to be coloured with for example select spectral. Then select apply.
If you cannot see each interval you may need to change the order the interval are being displayed in. to do this in the same section the above steps were completed click layer rendering, this will open more options to pick from, and then check off control feature rendering mode. After you do this a symbol to the right of that will become coloured, click on this symbol. In the menu that opens click the small arrow and in the drop down menu that opens select contour, then where it says ascending click the arrow and switch it to descending. Then click Ok. Back in the layer properties menu also click OK.
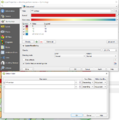
Symbology Menu

Finalized Service Areas
Once completing all these steps your service areas of the same travel time cost that are touching sould be dissolved into one another and all three layers of service areas should be visible like the image below.
5, 10, 15 minute walk service areas for Ottawa parks

Conclusion
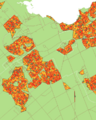
In looking at the two outputs from these tools it can be seen that the service areas created using the Valhalla tool are slightly larger than the ones made using the QGIS tool. While both of these tools successfully created an out put of service areas Valhalla did allow for more customizations and reliability with its network. While the QGIS tool could only create service area lines for one distance and some customization which more leaned towards being helpful for if you were creating service areas for driving.
The capabilities of the QGIS tool heavily relies on how good the network you've input is. In this case we used a road network and though we removed roads that definitely would not be walkable there may still be some road that realistically a person could not walk and we are still missing pedestrian paths that may have provided some faster routes. The QGIS tool also does not currently allow you to make intervals of the service areas and does not currently create isochrones (areas after connecting point for the same distance) but only creates lines. Well options are limited in this QGIS tool it runs well with no bugs and could definitely still be useful for network analysis.
The Valhalla plugin allowed lots of options for network analysis including several different tools for pedestrians, bicycles and automobile to take into considerations different paths each mode of transportation would use and different costs they may experience ex. stoping at stop signs for cars, Biking up steep elevation) which can provide a more realistic output. The Valhalla tool does have some small bug like if set to find the fastest route it is able to create an output of isochrones set for time intervals and for distance intervals but will give both the units minutes as talked about earlier in the tutorial. It is possible there are other small bugs like this in the other tools within the Valhalla plugin. This tool provided a great output with many opportunities to add a variety of parameters while creating your desired output and is straight forward and easy to use. Though it has some small bugs it still work very well for the desired output of this tutorial.
QGIS network analyst tool 10 minute park service areas
Valhalla 5, 10, 15 minute park service areas
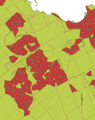
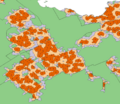
Valhalla 10 minute service areas (orange) and QGIS network analyst 10 minute service areas (red)

References
Valhalla website - https://valhalla.readthedocs.io/en/latest/valhalla-intro/
GIS OPS Valhalla post - https://gis-ops.com/valhalla-qgis-plugin/#Valhalla-QGIS-Plugin
GIS COURSE: QGIS network analyst capabilities - https://www.giscourse.com/qgis-network-analysis-capabilities/
QGIS Documentation: Network Analysis - https://docs.qgis.org/3.16/en/docs/user_manual/processing_algs/qgis/networkanalysis.html