Creating a map using GeoNode and QGIS
Contents
Introduction
Data is everything in GIS, and there are a plethora of ways to collect and analyze data for the purpose of creating a web in QGIS. But, as time goes on newer and more advanced methods of data collect have come about. That is what this tutorial is on. Using the GeoNode function in QGIS to bring in data without the need for downloading it manually. To start, what is GeoNode? GeoNode is a geospatial content management system, a platform for the management and publication of geospatial data. It brings together mature and stable open-source software projects under a consistent and easy-to-use interface allowing non-specialized users to share data and create interactive maps. This system allows users to collect and post various kinds of data on the internet, and gives others the ability to quickly and easily retrieve and use that data for their own purposes. Therefore, the purpose of this tutorial is to instruct new users of GeoNode on the basics of where you can find data, how to download it into QGIS, and then finally doing some standard IDW interpolation of the data.
Where can you find Data
First, lets cover how you can find GeoNode data.
The Right Sites
When it comes to finding sites that use GeoNode data, there are a lot of options to choose from. The first place you can look would be to go directly to the GeoNode website, at https://geonode.org/ . This site will give you a great basic description of the goals of GeoNode and the basics of how to create your own GeoNode server (don`t worry, we wont do anything that complicated in this tutorial). From this site you can access to GeoNode master demo site at https://master.demo.geonode.org/#/ . This GeoNode link will allow you to look at any data that has been added by any GeoNode demo user, as well as create your own maps, either from using data that others have added to the site or by adding you own. I would encourage you to sift around in this site and look at the data available. I will however note here, that as of right now QGIS`s GeoNode link does not allow you to connect to any data or maps that have been published on the demo site (we will talk about this limitation later). The other way to discover GeoNode data is to look for GeoNode galleries. These are sites et up for institutions like universities to publish data on. Sites like this can be used on the GeoNode function in QGIS. These sites offer a wide variety of data and I encourage you to look around the internet for these, as they are quite interesting. Here are some links to a few GeoNode galleries: https://www.geonode-gfdrrlab.org/ , https://geoportalouot.unah.edu.hn/ , https://www.atlas.alpconv.org/ .
Where to find the Tutorial Data
The data I gathered for this tutorial came from a GeoNode Gallery site used by the University of Sydney Australia at https://citydata.be.unsw.edu.au/layers/geonode:AirTemp_Sydney . This site will give us the data required to go further in the tutorial, more specifically this data is temperature data in Sydney, Australia from 2016 to present.
How to access the data
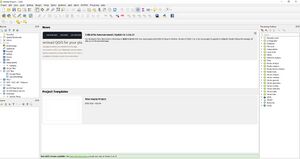
To bring this data in QGIS we must do a few things. First open up QGIS and create a new blank map.
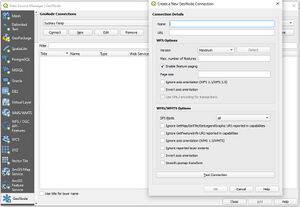
Now, scroll over to the top left of the screen and select the Layer tab. From here select the data source manger tool and scroll to the bottom, where you will see a tool named GeoNode, open it.
Now that we have the GeoNode tool open we have to go back to the Sydney temperature data website. On the bottom of the page you will see a hyperlink for the WMS GETCapabilities document. Open this link in anew tab. This Document is the link we will use to bring the Sydney data into QGIS.
Once this page is open, copy the URL at the top. BUT, this is important, do not copy the whole URL. I don`t know why it the GeoNode tool wont accept the URL if its the whole thing, but it won`t. simply copy up to the third backlash in the URL. Or simply just highlight the same section of the URL that it copied below.
Now you have everything you need to start brining data into QGIS via GeoNode!
Using GeoNode in QGIS
Now that you have the URL, we simply have to enter it into the GeoNode function in QGIS. Under the GeoNode function that you opened in QGIS, click on the new button. This will bring up a dialog box to fill out.
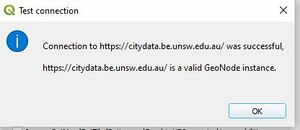
Simply enter a name for this new connection, and past the URL into the box below the name. After you`ve done this click the "test connection" button, and if done correctly you will get this message.
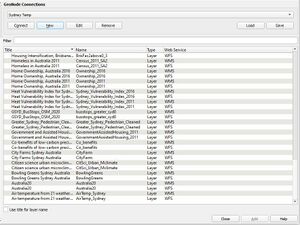
Once you`ve gotten the correct message, go back to the pervious GeoNode screen and hit the "connect" button under the new connection. This will bring up all the data connected to this GeoNode instance. In our case there is a lot of extra data attached to this instance. But we only want the temperature data, so scroll to the bottom and click on the article listed as "AirTemp_Sydney" (make sure to select the one that has WFS after its name, this is important, as the WFS selection will let us manipulate the data, unlike the WMS version). After clicking on this simply click the add button at the bottom and it will add it to your map. If you wish to add a shapefile for the districts this data is located in, also add the "LGAs_Sydney_and_surrounds" file to this map.
An alternative way to use GeoNode in QGIS
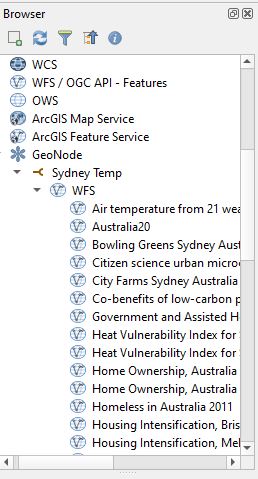
If the above method doesn`t work and you get error messages when attempting to add data, don't worry. There is an alternative method of adding data once the GeoNode connection has been made. On your browser page on the left simply scroll to the bottom and you will see the GeoNode function, underneath that you will see and arrow and the connection you named. Click on that arrow and it will bring up two further options, WFS or WMS. Select the WFS option. This will allow you to drag and drop all of the WFS files from your connection into the map. find the Sydney temperature data and area shapefiles here and drop them in. (NOTE both methods of adding this data will take some time, as your computer had to travel back to the GeoNode server to copy the data)
Creating an IDW interpolation
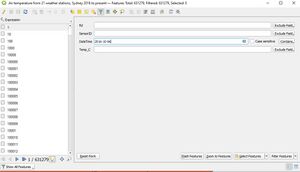
After you've added this data to the map we can start the process of using an IDW interpolation to interpolate the temperature data you've added. However, we cant just find the IDW tool and do this immediately. Since the data we have brought in covers 5 years of temperature data, there is too much to interpolate at once. We are going to make an interpolation for one day. Open the attribute table for your temperature data by right clicking and selecting attribute table. Now select the "select/filter features using form" button.
Now for the "DateTime" field scroll over the "exclude" field button and select "contains" instead. Enter the following date "2016-10-06", this will select only the features on this date. Hit the "select features" button on the bottom and it will begin (this may take some time).
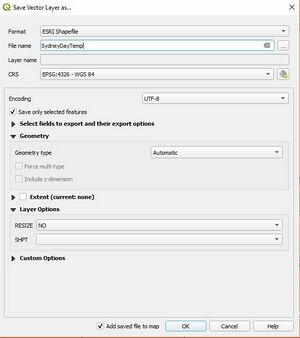
After this is completed you can select the "table form view" at the bottom right of the page to see all the features you have selected. We are now going to turn this select into a new shapefile that we can use to create an interpolation. Go back to your layers and right click your temperature data, and select the export button, then select the "save selected features as" button. This will bring you to a menu that will allow you to save this as ESRI shapefile. Change the "format" option to ESRI shapefile, and give your new layer a name. Then click the ok button below and we will have a new layer.
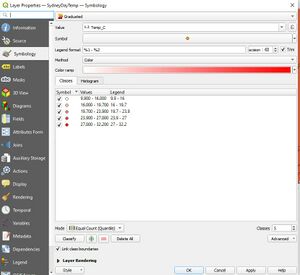
The last step we need to do before we can interpolate the data is to set the new layer to a different categorization. Go to the properties page for your new layer and open it, select symbology and change it from single symbol to graduated. from here just pick your color ramp, and hit the classify button at the bottom. The select apply.
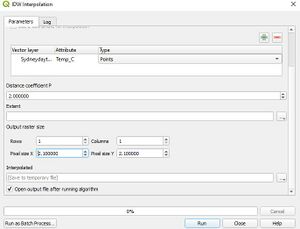
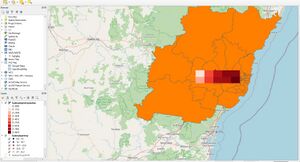
Now we can actually create the IDW interpolation, select the IDW interpolation button out of the processing toolbox on your right. Once this is open we need to do some things, change the vector layer to the new layer you just created. then select "Temp_C" as the interpolation value. Now click on the green plus symbol below to add a new feature, make sure it is set to points. Now we need to change the Distance Coefficient P to 1. Set the extent to the layer you just created using the three dots beside it. Now simply change the pixel size to two and save the file under and appropriate name. Once that is done, hit run and were good to go!
Now you`ve successfully used the GeoNode function in QGIs to create a map!!
Summary
In this tutorial you have learned how to use the GeoNode function of QGIS. This application is great for brining in sets of data without having to manually download and save them on your actual PC. Overall, GeoNode is a great service for creating and collecting data and map layers on a variety of issues. However, In QGIS`s current form there are some aspects of the GeoNode function that do not work, such as using the master demo site. As well as the long adjustment times whenever you move the map, as QGIS has to contact the data server every time the map is moved. But, I hoped you enjoyed this tutorial and I had a great time making it, thank you!

