Demonstrating tools in SAGA GIS to analyze Burned areas from Forest Fires
Contents
Introduction
In recent years forest fires have increased globally at a rapid rate destroying many hectares of vegetation, ecosystems and landscapes (Parajuli, 2019). Being able to analyse forest fires in multiple open source applications like SAGA GIS will benefit anyone looking to study the results of forest fires. Being able to manipulate raster files in many open source software will allow you as a user to to be able to pick and choose what software is better suited for your needs.
Downloading Saga
This tutorial uses the newest version of SAGA GIS, Version 8.4.1 64bit which can be downloaded here: https://sourceforge.net/projects/saga-gis/files/latest/download
Downloading Imagery from USGS
The first thing we will do to start off the tutorial will be finding data to run our analysis on. This tutorials imagery is found through USGS Earth Explorer. To actually download the data you have to make an account which is sound on the top right hand corner of the page, click login and it will bring you to a sign in page. At the Bottom it will ask if you want to Create New Account? This only requires a Username and Password of your choice. Once completed your able to start downloading imagery.
Selecting an Area of Interest
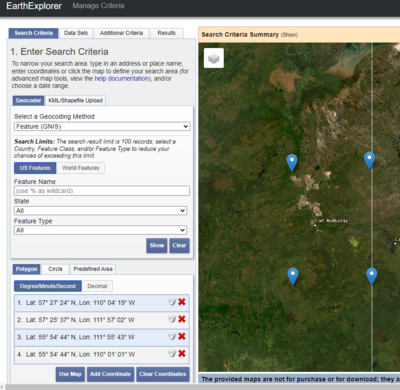
When selecting an area of interest in Earth Explorer it gives you many options of how to find the imagery you want. Your able to search for a selected name, search through states or feature types. In this tutorial we will be creating a polygon to choose our selected area.
Underneath the Geocode section you will see the Polygon tab. Select the tab and then go to your area of interest. Ours is Fort McMurry, you'll then left click to create the four corners of the polygon. The coordinates do not have to match but roughly in the same area.
Choosing a Date Range
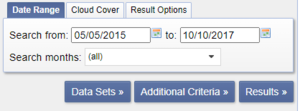
Underneath the Polygon tab you'll see a tab for Date Range. We will be looking at before and after the Fort McMurray Fire so we will need dates before and after the fire started and finished. The dates I selected were 05/05/2015 to 10/10/17.
Cloud Cover
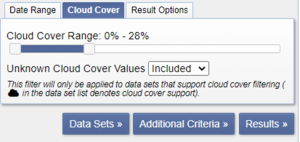
Beside the Date Range tab is the Cloud Cover tab. This tab allows you to reduce the amount of imagery that is unusable due to cloud cover. 28% was the selected amount of cloud cover allowed. After selecting the amount you can click on the Data Sets button to bring you to your search results.
Imagery Selection After Fire
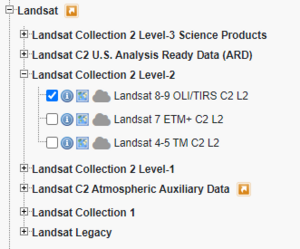
Before getting to results page you'll have to select the data sets you want. The files we want are found in the Landsat > Landsat Collection 2 Level-1 > Landsat 8-9 OLI/TIRS C2 L2. Once selected, click results.
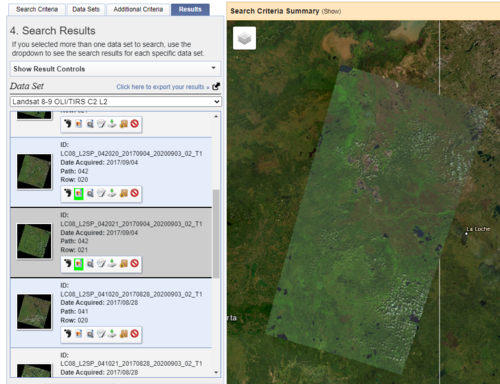
When choosing imagery we want the clearest image we can find. Too see what each image looks like select the button you can see highlighted in the image below. As seen in the image below, the dates 2017/09/04 with path 42 and rows 020 and 021 were very clear so they were chosen for the analysis.
Imagery Selection Before Fire
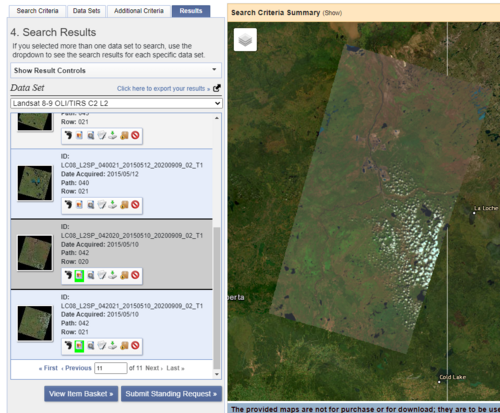
When selecting the imagery for before the fire, 2015/05/10 had the clearest imagery that matched after the fires path and row.
Downloading the Imagery
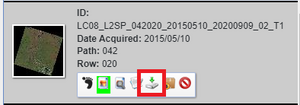
To download your selected imagery, on each image you will have to select the download button which can be seen highlighted in red.
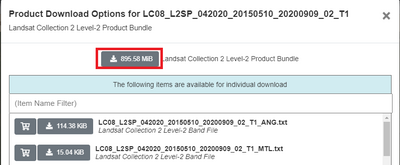
Then a download options window will open up and you will select Product Options. Then the image below will appear and you will be downloading all files, so selecting the entire bundle, as seen in red.
Converting Files
Some computers may have a hard time opening a Tar file. If you are unable to open the downloaded file, you may need to download a Tar file opener. For this tutorial we be using Winzip as the extension because windows does not know how to open Tar files. To download click this link:
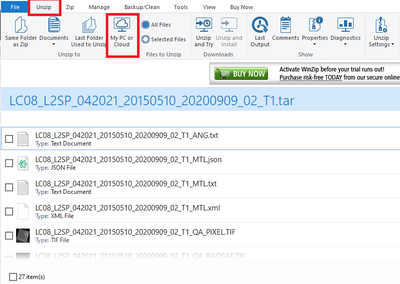
Once the application opens - find your tar files in your files and then drag them into the window pane. Once in WINZIP select the unzip tab shown below and then click My PC or Cloud to unzip the files to a specified location on your PC. Then we you go back into your files, the folders will be accessible.
Downloading Files into SAGA
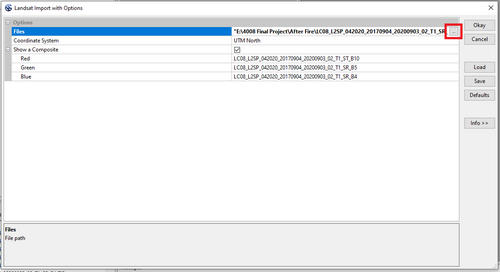
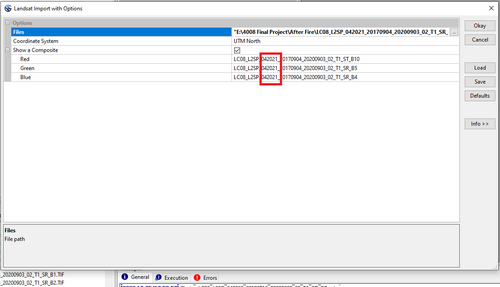
To download multiple files into SAGA you can either select them from your files in the bottom window pane or you can go through Geoprocessing > Imagery > Landsat > Landsat Import with Options which allows you to select from all your files. Beside files select the 3 dots to open file manager. Selecting imagery from after the fire we will be adding six files, Bands B4, B5 and B10 from row 42 and Path 20 and 21.
Highlighted in red in the row and path.
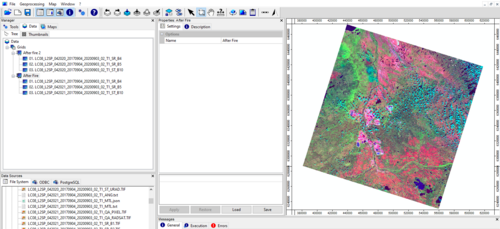
Once both after fire imagery is uploaded you'll be able to see the images in the right map pane. If not able to see you can right click on the bands you want and add to map. Adding them to the same map will over lap them.
After this is completed do the same process for the before fire imagery for both paths.
Mosaicking Two Rasters Together
This is just a demonstration of how to mosaic two rasters together for both before and after fire. If you want access a longer area of interest you can add the two sets of before imagery and after imagery. You'll find this tool in Geoprocessing > Grid > Grid Systems > Mosaicking.
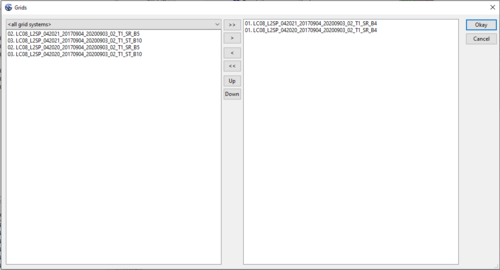
When the mosaicking window opens for each band you'll add the two path and row selections together. So Band 4's Path 42 and rows 20 and 21 will be merged together for each band. Just select the two bands and hit the single arrow to move the over and then hit okay.
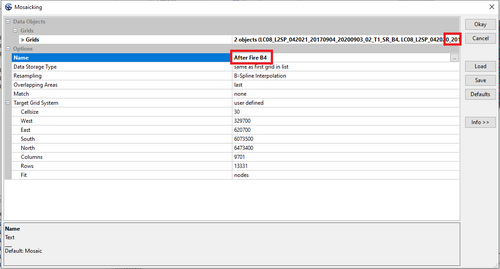
After for each band you'll want to rename them so your able to differentiate. I renames all bands After fire B4, After fire B5, etc. Then hit okay.
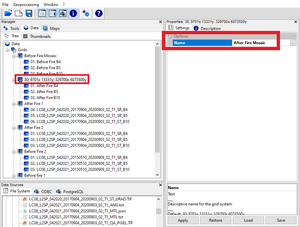
Then you'll want to rename the Grid so you know what your working on.
Then for each Grid for before and after the fire you'll want to rename as well to Before fire Mosaic and After fire Mosaic.
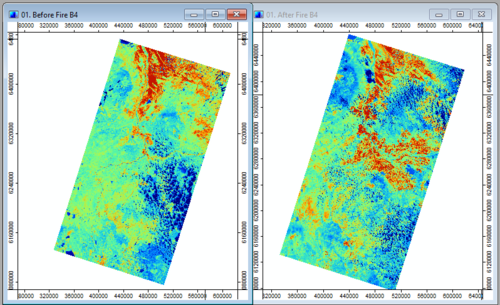
The results for Band 4 before and after will look like this in the map pane.
Fire Extent
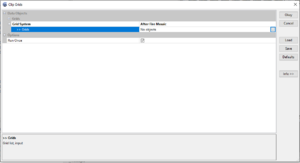
To get the fire extent first we will clip the grids together. Go to Geoprocessing > Grid > Grid System > Clip Grid. Select the first grid to work with which will be After fire Mosaic.
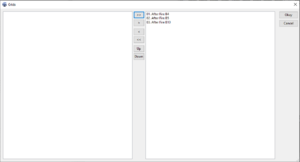
Then move all three bands over selecting the double arrows. And select okay.
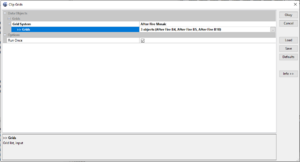
This should be what the window looks like after adding the bands.
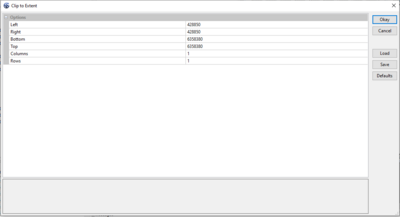
Under the options panel you'll want to make sure the extent is the same as your map. If everything matches up select okay.
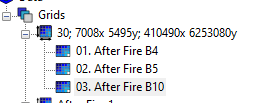
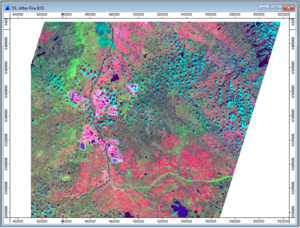
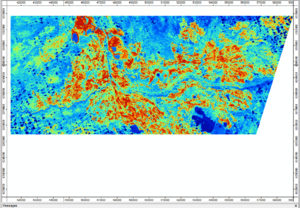
Too see what was just created. Select After Fire B10 and add to map.
The imagery below is the After Fire B10 New Grid.
The new grid will appear in your data manager and you will want to rename the grid to Clipped Grid.
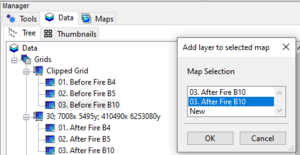
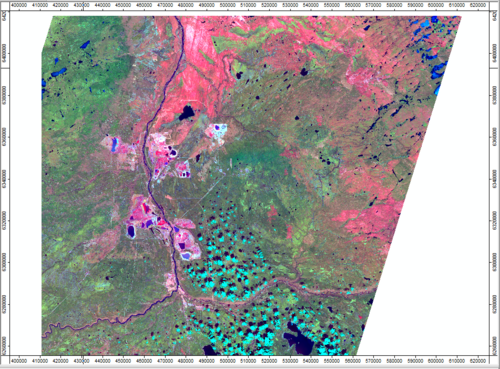
Adding the new clipped layers to the map pane.
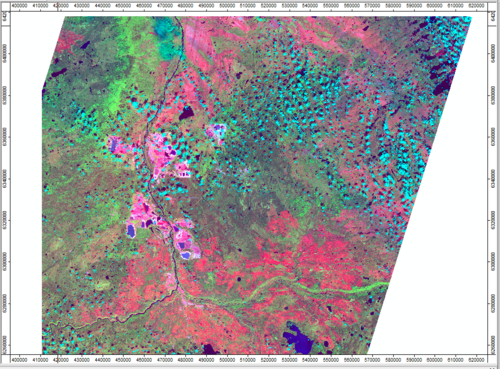
Below are the results of the fire extent for before and after the Fort McMurray Fire.
Before Fire Extent
After Fire Extent
Object Based Image Segmentation
"Image segmentation is a key component to object-based classification. Segmentation is a process by which pixels in an image are grouped into segments, objects or features, that have similar spectral and spatial characteristics. Each of these objects or features contain multiple pixels" (Humboldt State University, 2019). Object based image segmentation if extremely useful when analyzing forest fires because it allows similar pixels to be grouped together to get a better visual of similar pixels.
Clipping Smaller File
To start the process we will use the interactive clipping tool found in Geoprocessing > Grids > Grid System > Clip Grids interactive. We will be clipping the grid to the After Fire Mosaic. Drag the mouse over the area you want to look at. The resulted area selected is below. You will have to go back into the interactive clip to turn if off after you apply it.
Changing the RBG Composite
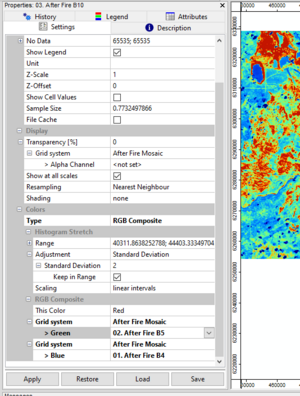
To change the composite of the imagery You'll go into the properties window pane of the map. At the top there will be five tabs, you'll select settings if it is not already displayed. The Type which is bolded in the image should be set to RGB Composite and then farther below make sure the Grid system is changed to After Fire Mosaic. Green changed to After Fire B5 and Blue changed to After Fire B4. Then hit apply and save.
Object Based Image Segmentation Tool
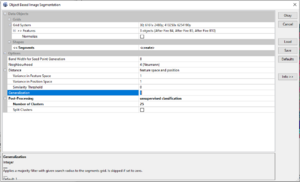
To find this tool it is in Geoprocessing > Imagery > Segmentation > OBIA > Object Based Image Segmentation. You'll select your grid system, your features which are After Fire B4, B5 and B10. For post processing you'll want to make sure it is set to unsupervised classification and the numbers of clusters set to 25. Depending on what type of area you are analyzing you can increase or decrease the clusters. Too many produce a very pixelated map and too little combines sections together. Then select okay.
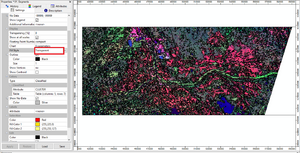
After the OBIS has run you will want to change the fill style to transparent to see the underneath layer.
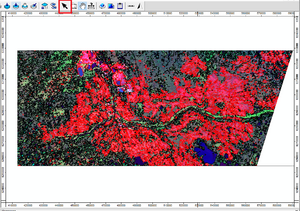
After your able to better see the burn extent, you will want to select the black arrow icon to select the the burn area.
Create New Shapes Layer
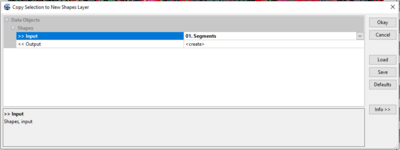
After selecting the burnt area you will want to create a new polygon layer of only the burnt areas. Geoprocessing > Shapes > Selection > Copy selection to new shapes layer. You will want to set you input tp segments and the output as create. Then hit okay.
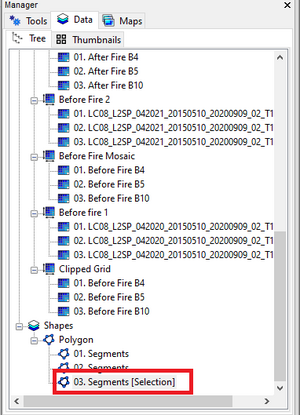
The results will be found in the manager window pane found under shapes and polygons.
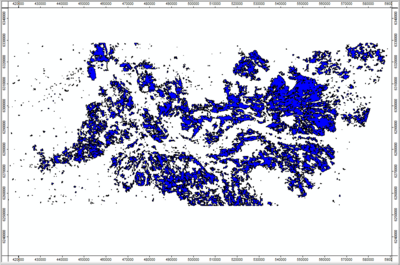
Adding the new Segments to a new map will produce an image like this, which is a polygon layer of only the burnt areas from the Fort McMurray fire.
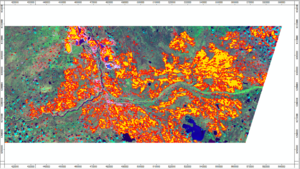
When adding the shapefile onto before the fire raster you are able to see the extent the fire raged through Fort McMurray.
Calculating Area of Fire
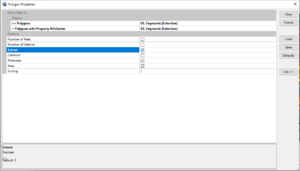
To calculate the burnt area of the fire you use polygon properties which is found in Shapes > Polygons > Polygon Properties. In The polygone properties you'll want to select Segments[selection] for both Polygon and Polygon with Property Attributes. The below in Options select the Extent, Area and Perimeter. Then hit okay.
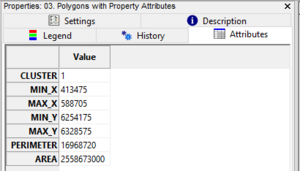
In the properties pane under attributes thus table will pop up will all values you just created about the polygon.
Conclusion
The tutorial will allow for users to look at a forest fire of their choice and be able to easily download imagery with specific dates for their region. It will allow users to be able to calculate the burnt areas of the forest fire. This tutorial will give the ability to analyse any landsat imagery for additional severity analysis of other burned areas, as well as being able to look at the burn extent of each area. This tutorial could help allow for operation planning of burned regions, look at crops and vegetation loss and other studies.
References
Ashok Parajuli, Ambika Prasad Gautam, Sundar Prasad Sharma, Krishna Bahadur Bhujel, Gagan Sharma, Purna Bahadur Thapa, Bhuwan Singh Bist & Shrijana Poudel (2020) Forest fire risk mapping using GIS and remote sensing in two major landscapes of Nepal, Geomatics, Natural Hazards and Risk, 11:1, 2569-2586, DOI: 10.1080/19475705.2020.1853251
Humboldt State University. (2019). Object- based Classification. Retrieved from: http://gsp.humboldt.edu/olm/Courses/GSP_216/lessons/Classification/object.html#:~:text=Image%20segmentation%20is%20a%20key,or%20features%20contain%20multiple%20pixels.
