Extracting OpenStreetMap data using Overpass Turbo and managing the data in QGIS
Contents
Introduction
OpenStreetMap is a treasure trove of free and open spatial data. It is a great resource for anyone that wants spatial information but can't access or find it anywhere else. OpenStreetMap gets its data purely from user contributions, and each day more and more people are contributing to its database. A full list of the features in OpenStreetMap can be found here: https://wiki.openstreetmap.org/wiki/Map_Features . It covers virtually everything, and if it doesn't you or anyone else can add your own features to its database.
The purpose of this tutorial is to give you a guide for how you can extract OpenStreetMap spatial data using the overpass turbo API and take that data (in GeoJSON format) into QGIS (the targeted data for this tutorial is power plants in Canada). Then in QGIS this tutorial will show you how you can cull and organize your data to create an aggregated spatial database of your OpenStreetMap features. If you can't afford to pay for spatial data or if you can't even find the spatial data you're looking for - this tutorial is for you. Once you complete this tutorial you will be able to extract any spatial information you want from OpenStreetMap and be able to manage it in QGIS.
Software
This tutorial uses QGIS and overpass turbo API. Below is a guide for how you can download and access these software.
QGIS
To download the latest version of QGIS follow this link: https://qgis.org/en/site/forusers/download.html . This tutorial uses QGIS 3.6 for macOS (virtually identical to Windows QGIS).
Overpass Turbo API
The following is a link to the overpass turbo API: https://overpass-turbo.eu/ .
Extracting OpenStreetMap data
Overpass Turbo
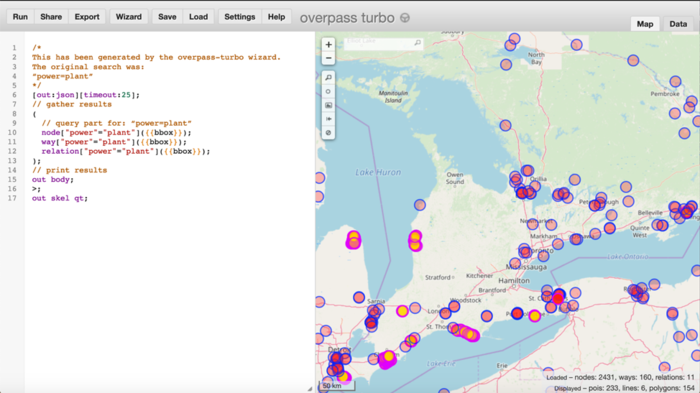
Downloading and extracting data in Overpass Turbo is easy to do once you know the basics. Below is an image of Overpass Turbo interface.
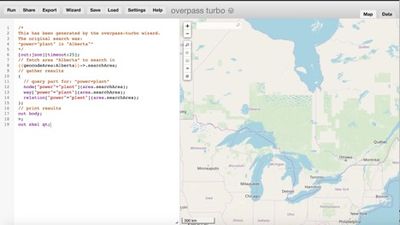
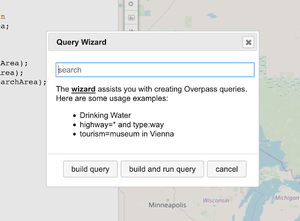
We will be using the “wizard” tool, which is located at the top of the Overpass interface, to create our queries in this tutorial. Click on it. You should now see the wizard window pop up as seen in the image below.
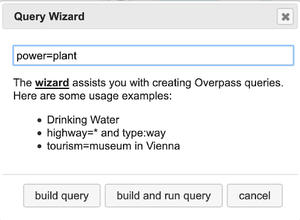
To create our query in the wizard we must specify the “key” and the “value”. For this tutorial we want to find all power plants in Canada so our key will be “power” and the value will be “plant”. (https://wiki.openstreetmap.org/wiki/Map_Features will give you a complete list of map features and their associated keys and values) In the search bar type in power=plant (see the image below).
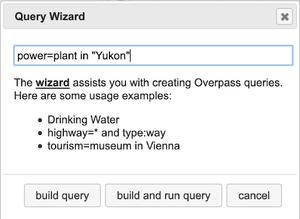
We can add a location to the end of our queries, or we can leave the location blank which when we query, will query all locations that are visible within the map screen. This does not mean we can query all of Canada at once. If we tried to do this we would get an error because its too much power plant data for Overpass to handle all at once. Therefore, we must query the power plant data several times over different areas to accomplish our task. An efficient workflow in our situation would be to query the power plants by province and territory. For example, see the image below.
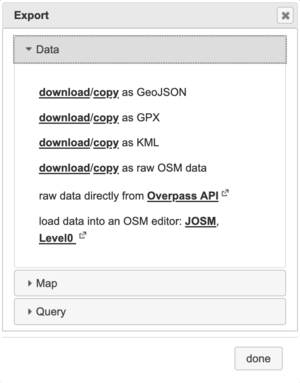
Click on “build and run query”. Once the query has run we can export our data. To do this, click “export” on the top toolbar. You should see the window in the image below.
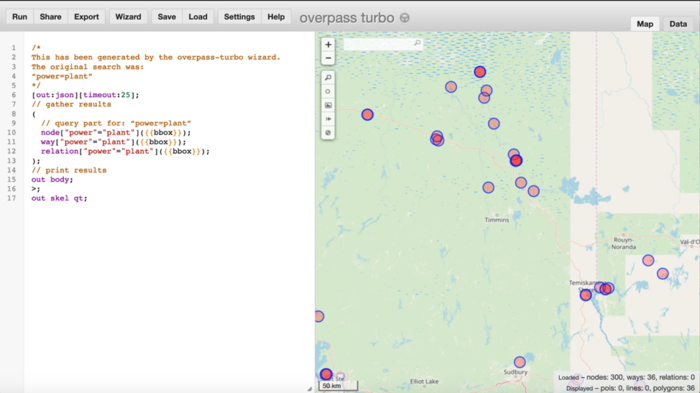
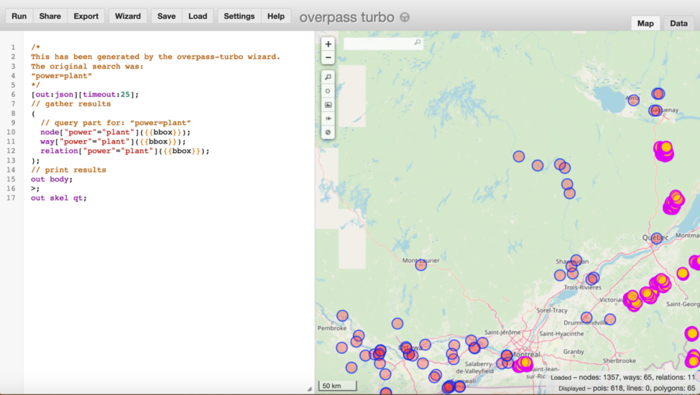
Click to download as GeoJSON. This is how we want our data. Do this process for each province and territory, except for Ontario and Quebec. We can’t query all of Ontario and Quebec because, like Canada, Ontario and Quebec both have too much power plant data for Overpass to process all at once. So for Ontario and Quebec we will query by shifting the map view. For example, see the images below.
Continue to do this until you have downloaded power plant data covering all of Ontario and Quebec. It is ok if some of the points overlap, or some of the points are in the United States – we can fix these issues later in QGIS.
Importing and managing the data in QGIS
OpenStreetMap base map
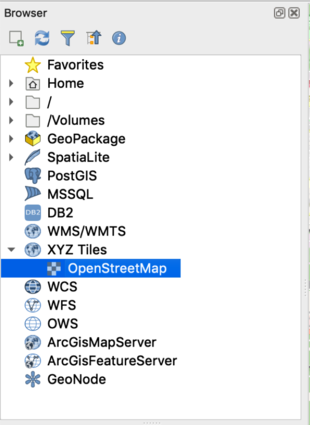
Once we have all of our data extracted, we can now add our data to QGIS. Before we do this however, you should activate a basemap in QGIS for reference. In the browser tab on the left hand side is a drop menu for XYZ tiles, click to drop down, and then double click on “OpenStreetMap”. Highlighted in blue, the image below shows you where to go.
Importing GeoJSON data
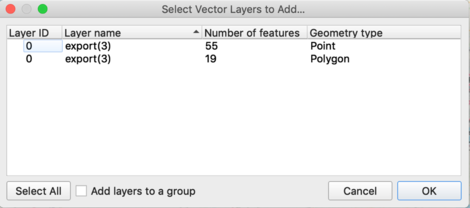
You can add your GeoJSON data by dragging and dropping the files from your file browser into QGIS. When you do this you may be presented with a window such as the one seen in the image below.
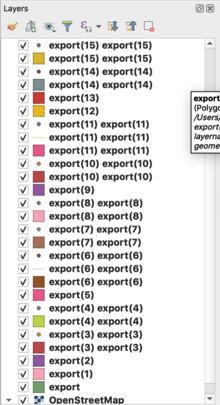
If this appears, click select all and then click OK. Once all your data is in your layers bar should look something like the image seen below.
Converting lines and polygons to points
Notice that we have points, lines, and polygons. For our purpose we want points only.
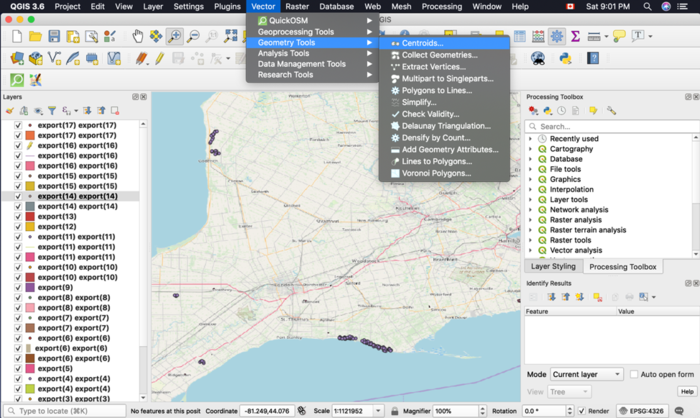
To convert polygons and lines we will be using the centroid tool. The centroid tool can take any kind of vector layer convert it into a point by taking the central geographic location of that layer. To access this tool click on the vector toolbar at the top, go over geometry tools and then click on “centroids”. See the image below for reference.
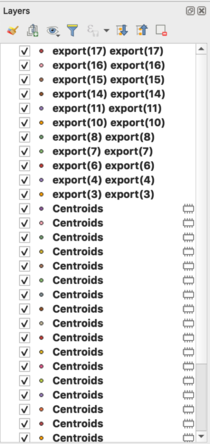
In the centroids window, under “input layer”, select a polygon or line layer and click “run” in the bottom right corner. Leave the defaults on. Repeat this process until all line and polygon layers have been converted to centroid layers. Do not run the point layers in the centroid tool. Once that is completed you can start trimming the data down by deleting all the polygon and line layers. Your layers bar should look something like the image below (i.e. with point layers only).
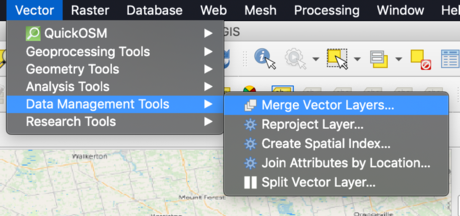
The next step will be to aggregate all of these point layers into one aggregated point layer. Go to vector->data management tools-> Merge Vector Layers (see the image below for reference).
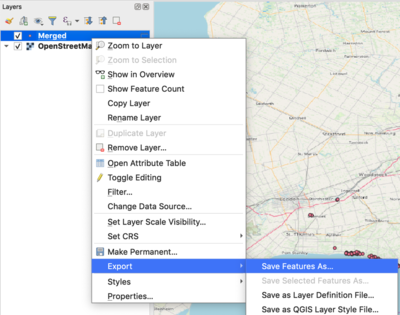
This tool will accomplish our goal very easily. In the merge vector layers window click on the input layers “…” box. A “multiple selection” window should have now popped up displaying all layers ready to be selected. Select all (trusting that you deleted all polygon and line layers. If not, manually select all of the point layers). Choose “ESPG:3857 – WGS / Pseudo-Mercator” as your destination CRS (coordinate system). Then click “run”. Now is a good time to save your merged vector file. To do this, right click the merged layer, go to export->Save Features As…. See image below for reference.
Save it as an ESRI Shapefile, and choose the save location and file name to your choosing. Optional: you can remove all previous point layers from the layer bar.
Deleting unwanted data
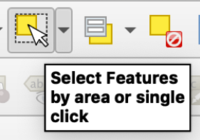
If there are points in the United States (there most likely will be) then you will want to remove those points. This is easily done. Right click the saved merged layer, then select toggle editing. Then click on the “Select Features by area or single click” icon in the top toolbar (see image below).
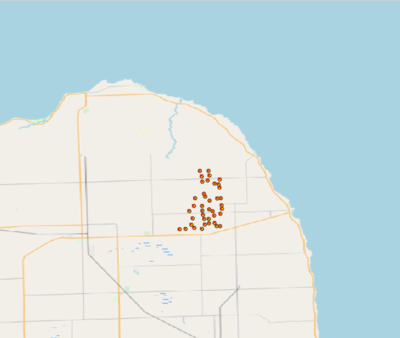
This will allow you to select multiple points in the United States at once, and then delete them. For example, in the image below, a cluster of power plants in Northern Michigan have been selected (yellow highlight and red X indicates that it is selected).
Once you have one point or multiple points selected you can delete these points. You can do this by clicking on the delete icon in the edit toolbar (see image below for reference).
Do this until all United States power plant points have been removed from the layer. You can save your edits along the way (save icon in the edit toolbar) or save them all at once when you toggle off editing in the end.
We now have a layer containing all of Canada’s power plants (in Open Street Map) in point vector format (and no American plants). Great.
Finished product
Make your sure to save your project and shapefile. You now have a spatial database of Canadian power plants in QGIS. Congratulations, you should now be able to extract any OpenStreetMap data you desire and manage that data in QGIS. The possibilities are endless. Well done.
Additional Resource
Create an OpenStreetMap Account
The following is a link for the OpenStreetMap sign up page: https://www.openstreetmap.org/user/new . The sign up process is straight forward. OpenStreetMap is great for anyone who wants to make a contribution to free and open spatial data. It is highly recommended that you check it out and contribute.
