File:NO2 Time Series Plot.png
From CUOSGwiki
Jump to navigationJump to search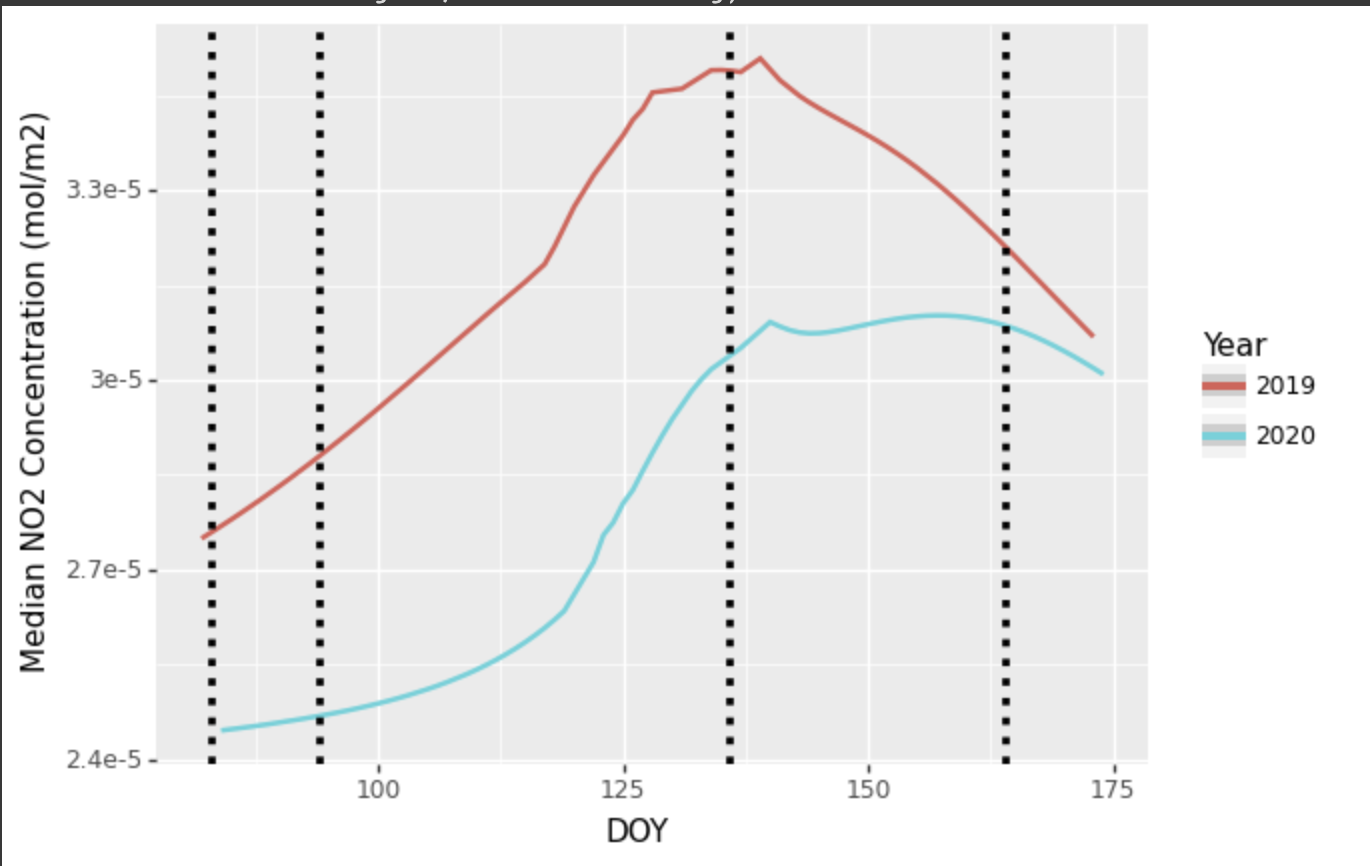
Size of this preview: 800 × 506 pixels. Other resolutions: 320 × 202 pixels | 1,370 × 866 pixels.
Original file (1,370 × 866 pixels, file size: 190 KB, MIME type: image/png)
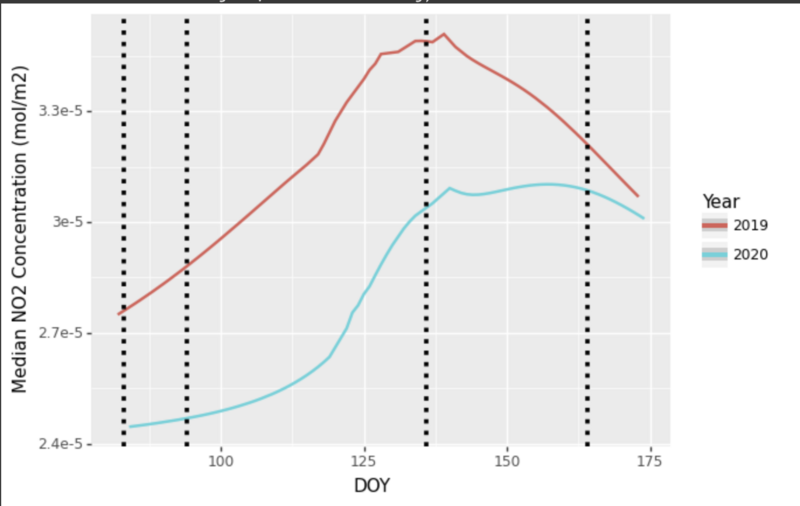
A plot of NO2 levels in 2019 and 2020 in Toronto
File history
Click on a date/time to view the file as it appeared at that time.
| Date/Time | Thumbnail | Dimensions | User | Comment | |
|---|---|---|---|---|---|
| current | 00:44, 23 December 2021 | | 1,370 × 866 (190 KB) | MatthewWierdsma (talk | contribs) |
You cannot overwrite this file.
File usage
The following page uses this file: