Google Earth Engine to look for and download imagery
Google Earth Engine (GEE) is a web/cloud-based service that brings together many open spatial data sets including imagery and other spatial data, plus analytical tools and processing capabilities that allow users to work with spatial data at very high spatial extents. Google provides free access to this service for research and educational purposes, and also provides fee-based access to commercial users. Because it brings together so many open geospatial datasets in one location, many users primarily access the service for that reason alone. This tutorial aims to demonstrate how this could be done, with one specific example, but the approach could be easily generalized. Future edits to the tutorial could expand to show other datasets and/or pre-processing steps prior to the download. There are two APIs for accessing the service; the original, used by this tutorial, employs Javascript, but there is also a Python-based alternative.
Prerequisites
You will require a Google account that you can log in to. If you have one that has a higher storage limit, you may want to choose that one, because we will use Google Drive to get access to the images that we want to download.
You also need to go through a one-time signup process for the GEE service. Use this link to sign up for the GEE service. If you are using / have previously used any Google logins in your browser, it should detect that, and if you have used more than one Google account it should prompt you which one to sign up with.
At the end of this tutorial, we will use local software to take a look at a local copy of the image we extracted. You can use any program that is capable of reading a GeoTIFF image. QGIS is one free open source option, and will be used in the example below.
Logging in to the Code Editor and creating a new script
If you are not already there through the signup process, or whenever you want to return to your account, you can to the code editor here.
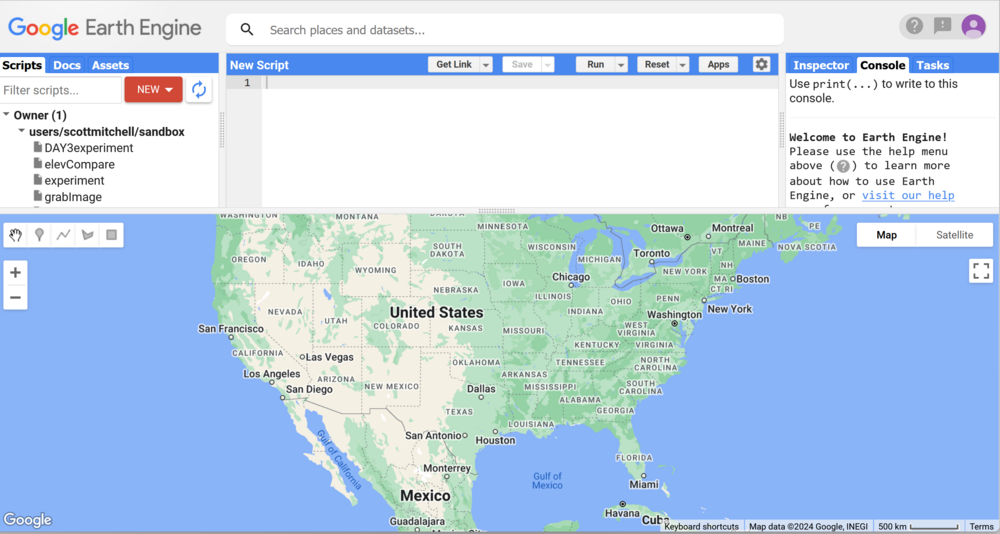
You should end up with a browser window looking something like this:
The area at top left opens by default to a tab called "scripts" which contains an initially empty "sandbox" where you can create your own scripts, and if you scroll down, perhaps the most interesting sections you'll see are the "examples" and "demos" sections. You can explore there on your own. We're going to start by creating a new script in your sandbox. Click on the red "New" button at the top of Scripts tab, choose the File option, and then input an appropriate name for your script (I'll use "findGetImage"). Click on the resulting entry in your sandbox, and you should see your script name appear at the top left of the code writing window immediately to the right of the script list.
Choose and digitize an area of interest (AOI)
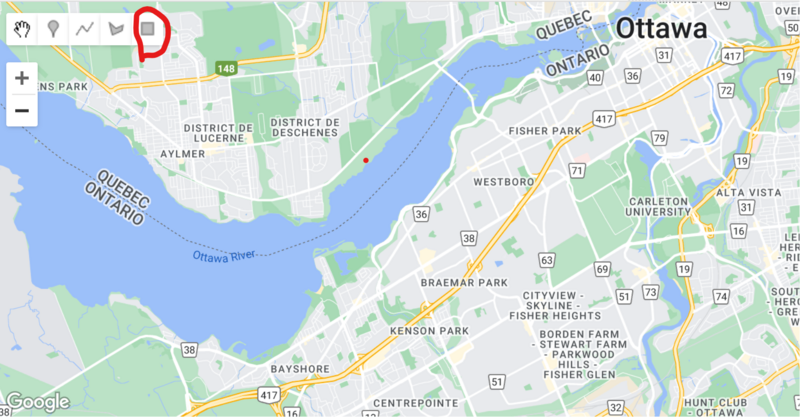
The bottom half of the code editor is used for navigating and manipulating maps. If you have never used the interface before, it is likely showing you a map showing most of the continental United States. The controls should be familiar if you have ever used Google Maps or similar software. Use the mouse/trackpad to pan to the area of the globe you are interested in, and then the + and - icons near the top left of the map to zoom to an appropriate spatial extent. In the example below, I have zoomed into an area surrounding our campus - Carleton University, in Ottawa, Ontario, Canada.
Now we're going to draw a rectangle to define our area of interest, so that in a future step we can clip our selected imagery data to this selected subset. Click on "Draw a rectangle" button on the tool bar (circled in red in the screenshot below).
After you click on the tool to draw a rectangle, graphics similar to the following should show up on the screen to the right of that tool bar:
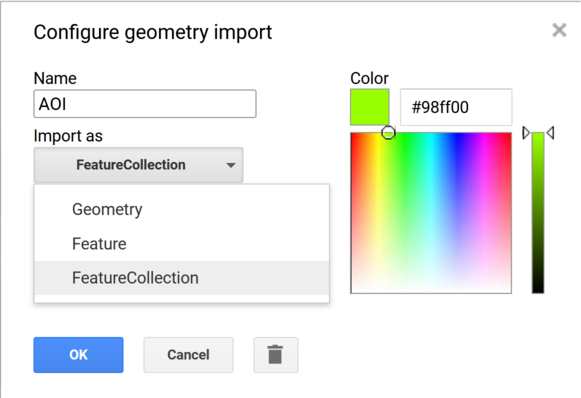
Move the mouse pointer over to where it says "geometry" and click on the gear icon. In the resulting pop-up, change the name from "geometry" to "AOI", and in the drop-down menu below that, choose "FeatureCollection", as illustrated below:
Note that you now have a "var" (variable) called AOI showing up as an Import at the top of your script window (centre top of the interface). In the GEE Javascript environment, all the spatial layers you will access will be declared and accessed using a variable. In this case it has been declared as a FeatureCollection, but so far it's a collection of 0 items. Let's fix that, by digitizing a rectangle to use as the area of interest, by clicking your mouse button at one corner of the desired area on the map, dragging down to the opposite corner and releasing the button (i.e. using your mouse to draw a rectangle). When you finish, the rectangle should remain on the screen, and there should be 1 element showing up as belonging to the AOI feature class in the script window.
This seems like a good time to save our work so far. Click on the save button at the top of your script window. When it is saved, the save button should become greyed out.
Click into line 1 in your script window and type or paste the following text
// access the Landsat 8 image collection
var landsat_8_collection = ee.ImageCollection('LANDSAT/LC08/C02/T1_L2')
 .filterDate('2017-01-01', '2023-12-31')
 .filterBounds(AOI);
That's actually one declaration of a variable, split across a few lines for legibility. The first line shows that we are declaring a variable called landsat_8_collection, and the ee.ImageCollection function tells the system we want to access the USGS collection of Landsat 8, Tier 1 (top level of USGS screening for radiometric and geometric quality), Level 2 (atmospherically corrected surface reflectance data) images (see this link for more details). But then in the next two lines, the leading "." means that we are applying further processing to the preceding line(s); I have specified 2 filters for searching the data collection by adding a time window (the .filterDate line) of 1 Jan 2017 to 31 Dec 2023, and then in the next line asking only to include images that intersect our area of interest polygon.
Next we'll go from the preceding collection of images to picking out a single image. There are many ways one might want to do this, depending on the desired purpose for the image; we could explore the collection interactively, or choose specific timing... but for simplicity in a demonstration, I'll ask the system to search through all the images and look at the metadata about cloud cover, sorting the collection in order of that data, and selecting the first image in the list (the one with the least cloud cover. Paste the following code at the end of your existing script:
print(landsat_8_collection);
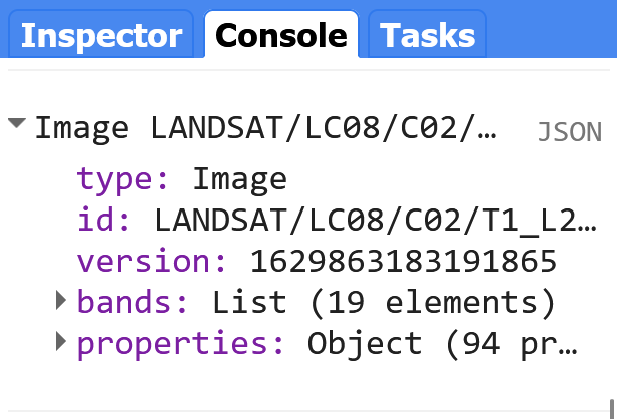
Press the Run button in the bar across the top of your script window. This time something shows up in the Console, to the right. Click on the triangle icon beside "ImageCollection" in the console, and it should expand, showing you the type, id, version, ... and if you click on the triangle beside features, it will expand into the list of images that the system found that met your query.
Now add the following lines to the bottom of your script to access a specific image:
var landsat_8_chooseBest = ee.ImageCollection('LANDSAT/LC08/C02/T1_L2')
 .filterDate('2021-06-01', '2021-10-01')
 .filterBounds(AOI)
 .sort('CLOUD_COVER')
 .first();
print(landsat_8_chooseBest);
Save your script again, then press the Run button to the right of Save. More output should appear in the Console area at the top right of the interface. Let's go over what each of the lines of code in your script so far accomplished, and how they relates to what appears in the console.
The first lines, declaring the variable identifying our initial collection of images, produces no output - it just runs in the background, defining the requested subset of images. We use print statements to cause information ABOUT that object to show up in the console. We already looked at the ImageCollection, and now there's another block describing a specific image, defined by a new variable landsat_8_chooseBest. It was created by again called on ee.ImageCollection, but this time we did the sorting based on cloud cover, and also restricted the time windows to be sometime in the 2021 growth season (in this case, June 1 - October 1). Click on the triangles in the Console to confirm there is metadata about only one image showing up for landsat_8_chooseBest.
To see the image on the map instead of just trusting the metadata, we need to explicitly add it, with the following code:
// set some visualization parameters, in this case which bands to render,
// and what values to stretch between when assigning brightness
var visParams = {
  bands: ['SR_B4', 'SR_B3', 'SR_B2'],
  min: 6000,
  max: 12000
};
 // add the layer to the map
Map.addLayer(landsat_8_chooseBest, visParams);
The visParams declaration specifies the bands from the image that should be used (I chose the visible red, blue, green layers), and what raw values between which it should stretch the on-screen rendering of brightness (chosen based on an example in GEE's Landsat data guide).
Note that it is not yet restricted to just our area of interest, though - you can see the full scene that had the least amount of cloud cover. So next we'll clip the image, with the following code:
// clip the image
var landsat_8_best_clipped = landsat_8_chooseBest.clipToCollection(AOI);
Map.addLayer(landsat_8_best_clipped, visParams);
Run the script again, and then you can click where it says "Layers" near the top right of the map and then uncheck Layer1, to verify that the new Layer 2 indeed only exists within the AOI polygon (which can also be turned off if you wish, by unchecking in back over in the Geometry control).
Finally, we'll export the clipped image to our Google Drive, with the following code and procedure:
// Export our image to a GeoTIFF on our Google Drive
Export.image.toDrive({
   image: landsat_8_best_clipped.toFloat(),    //cast it all to float so export doesn't fail (Band 16 is different)
   description: "exportedImage",    //concatenate the name with uniqueID appended as it will appear in the tasks list
   folder: "MyImages",         //this is your google drive folder where each file will be saved
   region: AOI,     //this is the clipping polygon (can be multiple)
   scale: 30
 })
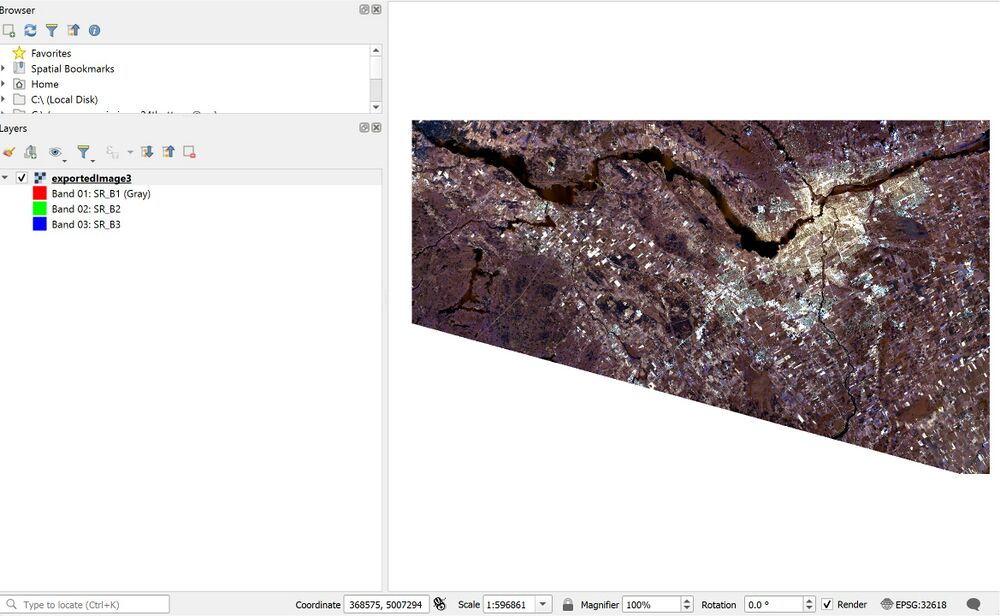
That doesn't actually do the export, but it creates a "task" to do so. Over in the same area of the interface where we previously looked at metadata output in the Console, click on the Tasks tab. When you run your code, it should make an "unsubmitted task" show up here, labelled "exportedImage" - click on the Run button beside it. In the resulting pop-up, the defaults should all work to create a GeoTIFF file, with a spatial resolution of 30 m, a file name of exportedImage, in a file folder called MyImages on your Google Drive. The actual export can take some time - it took about 5 minutes to export my example, which was only about 1/8 of a Landsat scene. The image below shows what it looked like when I read the resulting GeoTIFF into QGIS.
That's it! Now that you've seen the basics, I recommend you look around in the GEE documentation to look for other possibilities - for example, there are lots of code examples in the Landsat data guide such as converting from raw sensor values to radiance and top of atmosphere reflectance, and of course there's all the other imagery and other geospatial data in the collections as well.
Thanks to Koreen Millard for teaching me all this, and for her generous sharing of examples and teaching materials.
