Land Use Land Cover Change Detection with Supervised classification in QGIS
Contents
- 1 Introduction
- 2 Installing QGIS
- 3 Downloading the Data
- 4 Installing the SCP Plugin
- 5 Importing and Processing the Data
- 6 Working with SCP Plugin
- 7 Creating Bandset
- 8 Supervised Image Classification
- 9 Training Inputs
- 10 Training Classes
- 11 Assessing the Spectral profile of the Classes
- 12 Classification
- 13 Detecting the Land cover change
- 14 Conclusion
Introduction
Land Use Land Cover Change Detection reveals trends, patterns, changes in land use and land cover pattern in an area. Observing changes in land cover using remotely sensed data such as satellite images provide information for decision-makers. Open source software such as QGIS offers enhanced capabilities to effectively classify satellite images and monitor changes with temporal data. Additional plugins such as the Semi-Automatic Classification Plugin (SCAP) help in working with freely available images such as the Landsat, Sentinel etc. In this tutorial, I will be walking you through performing supervised classification on two different images and observing changes that have occurred using the SCAP plugin in QGIS.
Required Materials Data: Landsat 8 Software: QGIS 3.28.0 Plugin : Semi-Automatic Classification Plugin Area of interest: Attica, Indiana, United States Period of study for change detection: Jan 1, 2015 and Jan 1, 2021
Installing QGIS
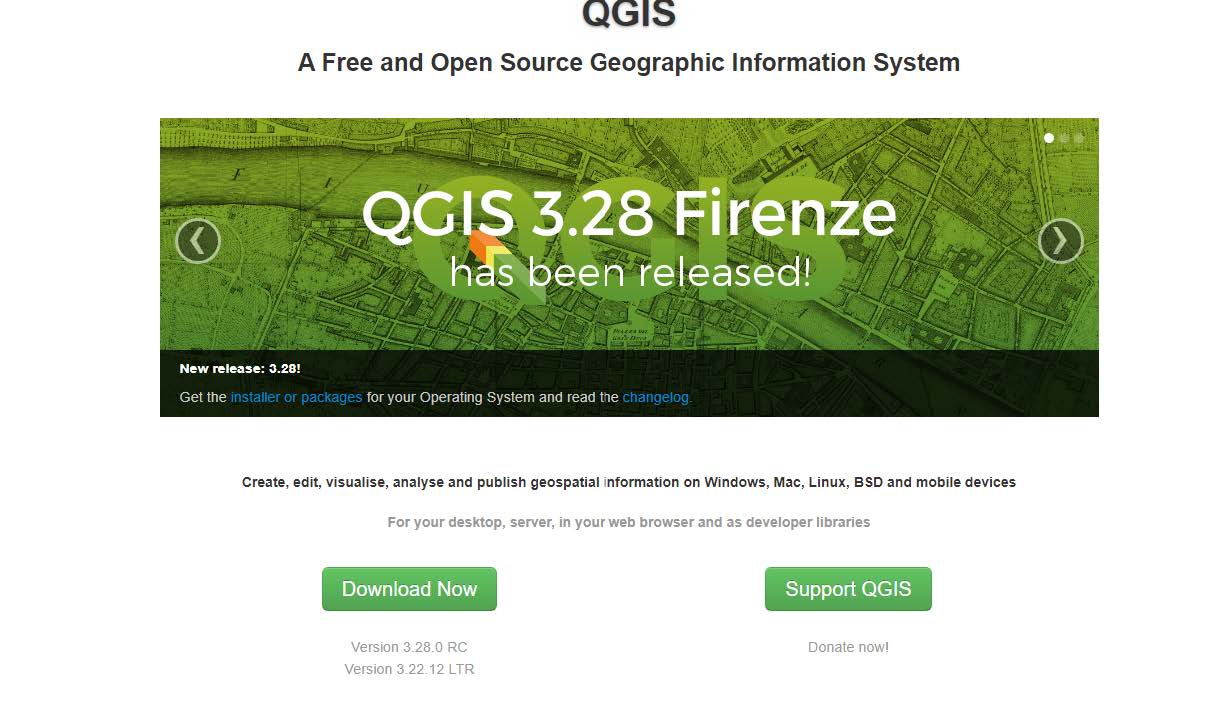
QGIS is an open-source GIS software whose acronym stands for Quantum Geographic Information System, QGIS is equipped with capabilities that allows for all sorts of GIS analyses. QGIS has different versions, it is advised to install the current version which is QGIS 3.28 Firenze. To install, Visit the QGIS here website.
Click on the download now Button Install the software by following all necessary prompts
Downloading the Data
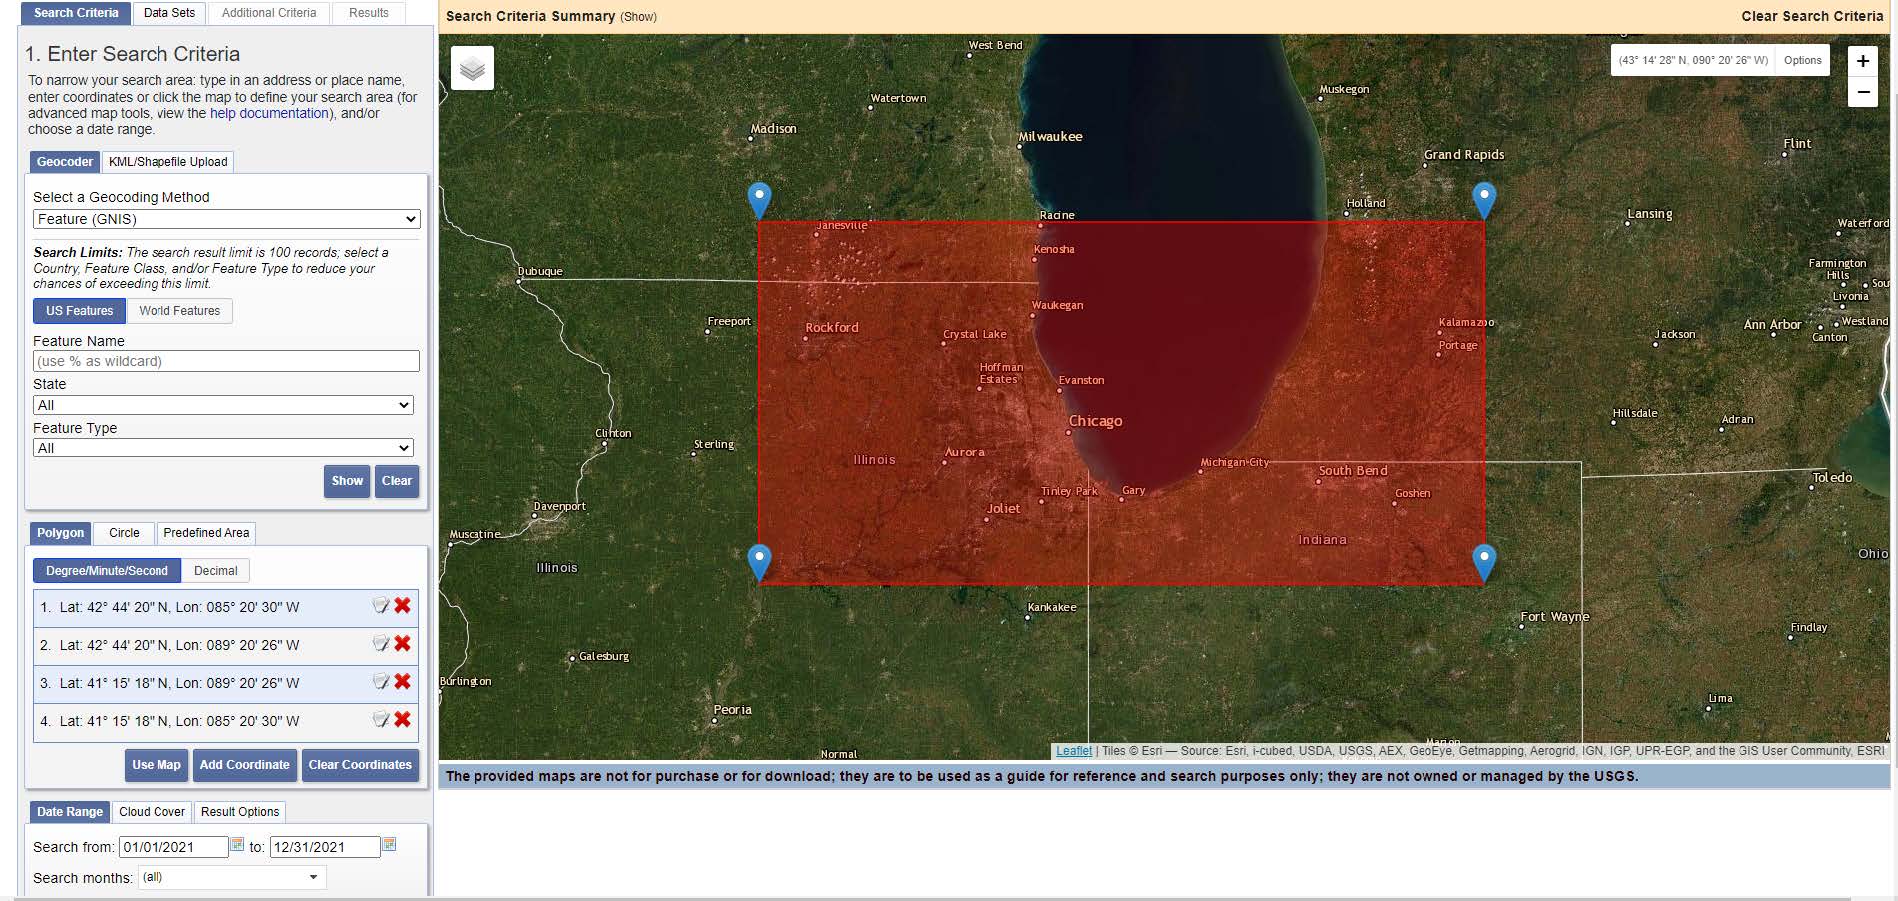
This tutorial will be employing the use of free and easily accessible satellite imagery for this analysis. The data to be used for performing change detection analysis has to be obtainable for two different periods of time so that the change can be observed. Also, another very important requirement is the emphasis on the use of satellite images with little or no cloud cover. The presence of high cloud cover on the imagery affects the result of image classification. Freely available sites such as the Landsat and Sentinel can be easily downloaded and used for analysis from Earth Explorer here , GloVis here , Copernicus Website here, Nasa here etc. For this tutorial, the website would be used. Different satellite images can be used for performing change detection analysis, however, the data to be used must have historical capabilities, such that one can go back in time and use the data for the analysis, the spatial and spectral resolution must be high enough to easily distinct land features at a required scale. To download the data, visit the EarthExplorer here website. Note, you will need to create an account register. Search the preferred data by entering the coordinates of the area, as shown in the image below.
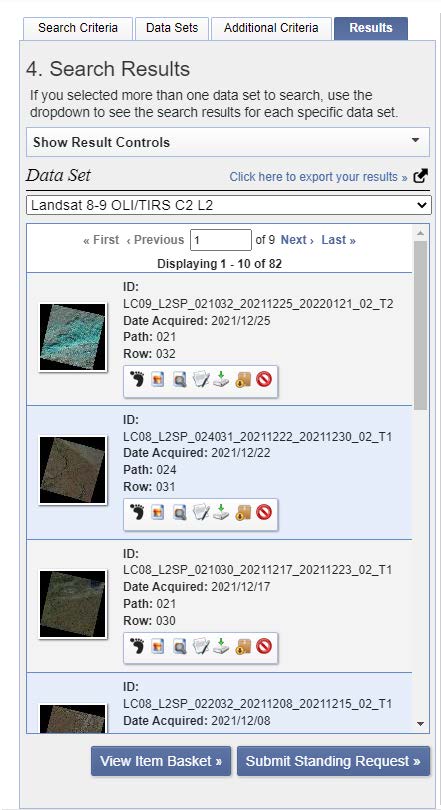
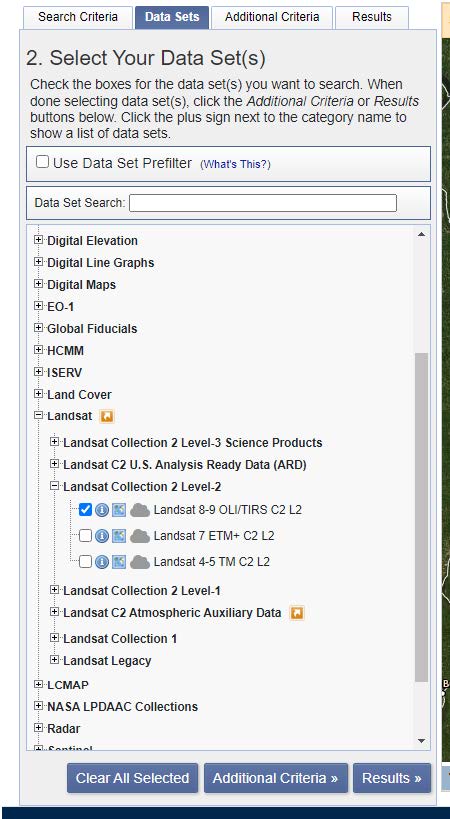
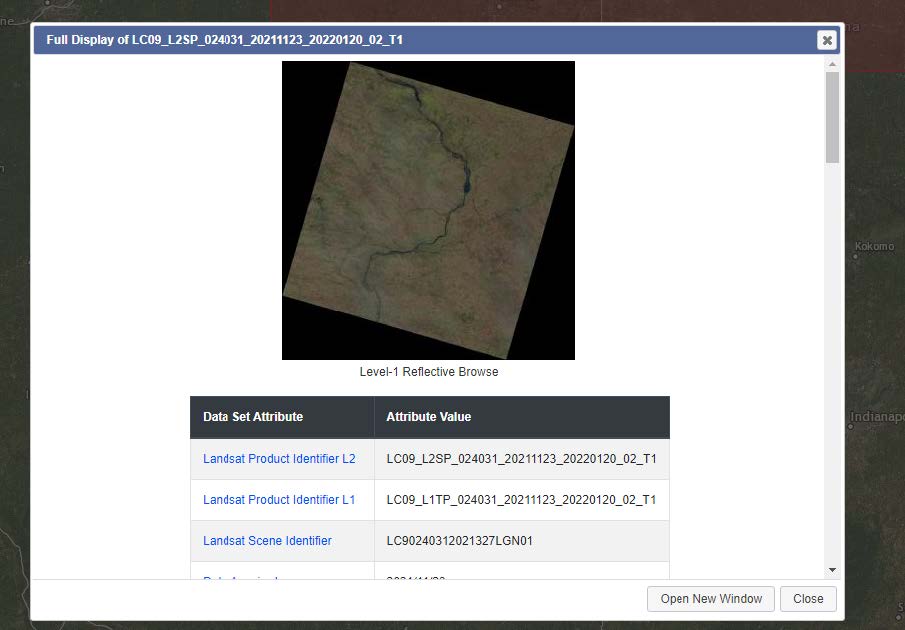
The earth explorer page helps in specifying the exact data we want. Metadata on the required data such as the cloud cover level, date specified can be specified. To download data, you need to input the date of acquisition of data. For the Landsat series, the earth explorer website has the Landsat 4, 5, 7, 8 and 9. Each member of the series has different specifications such as the spatial, spectral, radiometric and temporal resolution. After filtering the data, the result of the filtering shows data that matches the search criteria. You can still check individual results, by clicking the metadata bar to check the detailed metadata of the data to be downloaded.
You can see the metadata of the Landsat data to download, size and individual Landsat bands respectively.
- Working with the Data in QGIS and SCP
Installing the SCP Plugin
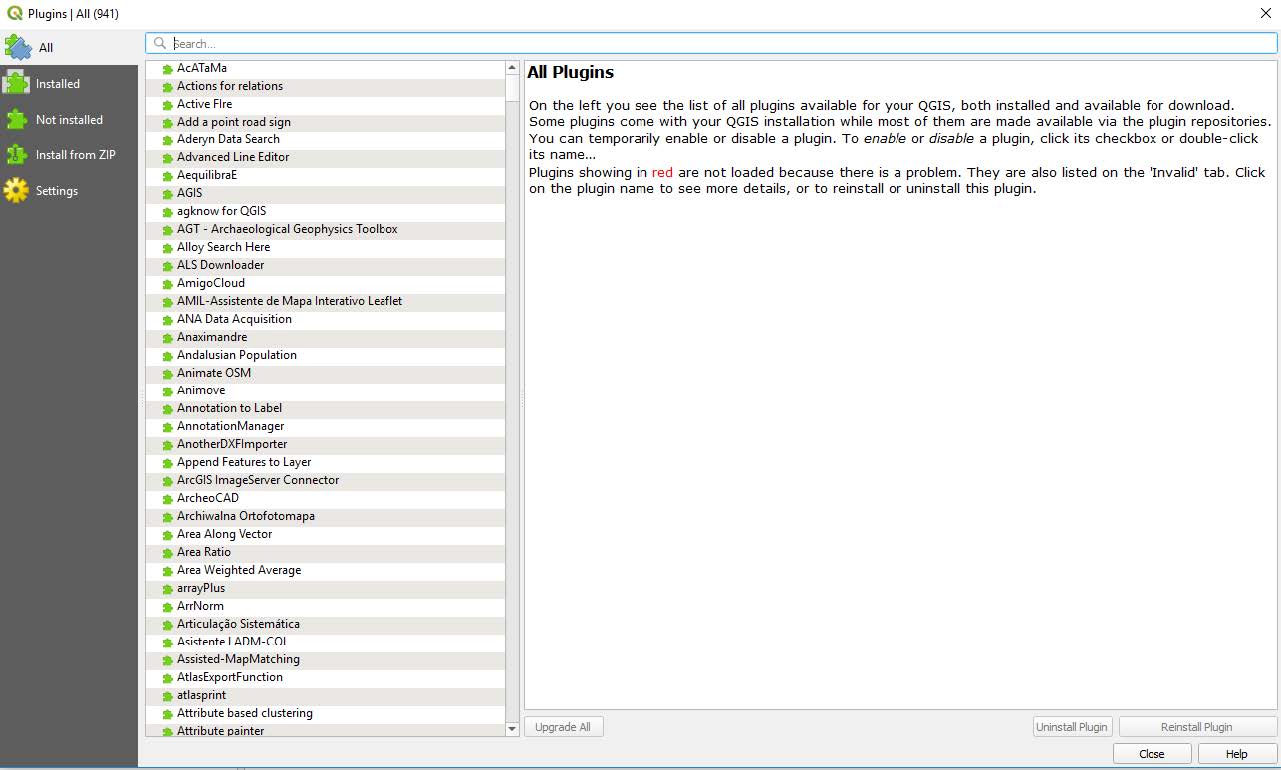
One of the reasons QGIS is very effective in performing change detection is due to the numerous plugins it has. The Semi-Automatic Classification Plugin allows for performing supervised classification, processing of images, and change detection amidst many other use cases. To install the plugin in QGIS, navigate to Plugins and Click “Manage and Install Plugins”.
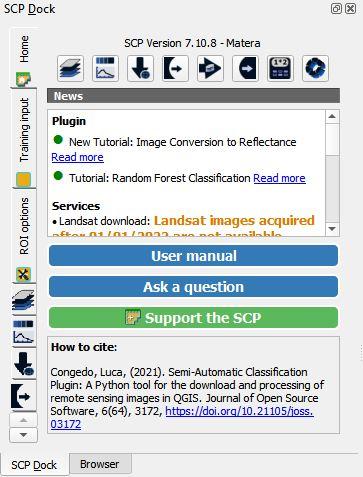
Once installed, the plugin is added to QGIS layout bar. The plugin contains SCP dock, SCP Working Toolbar and SCP editing toolbar. If these, are not added, you can click on the empty space in the QGIS Layout, to activate it.
SCP Working Toolbar
SCP DOCK
Importing and Processing the Data
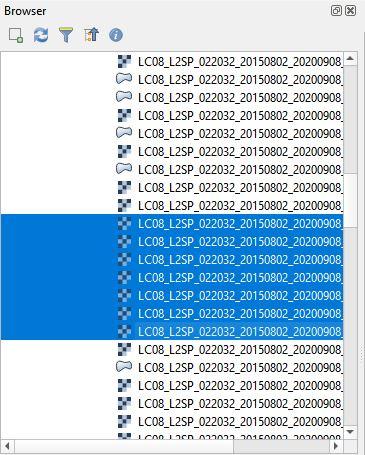
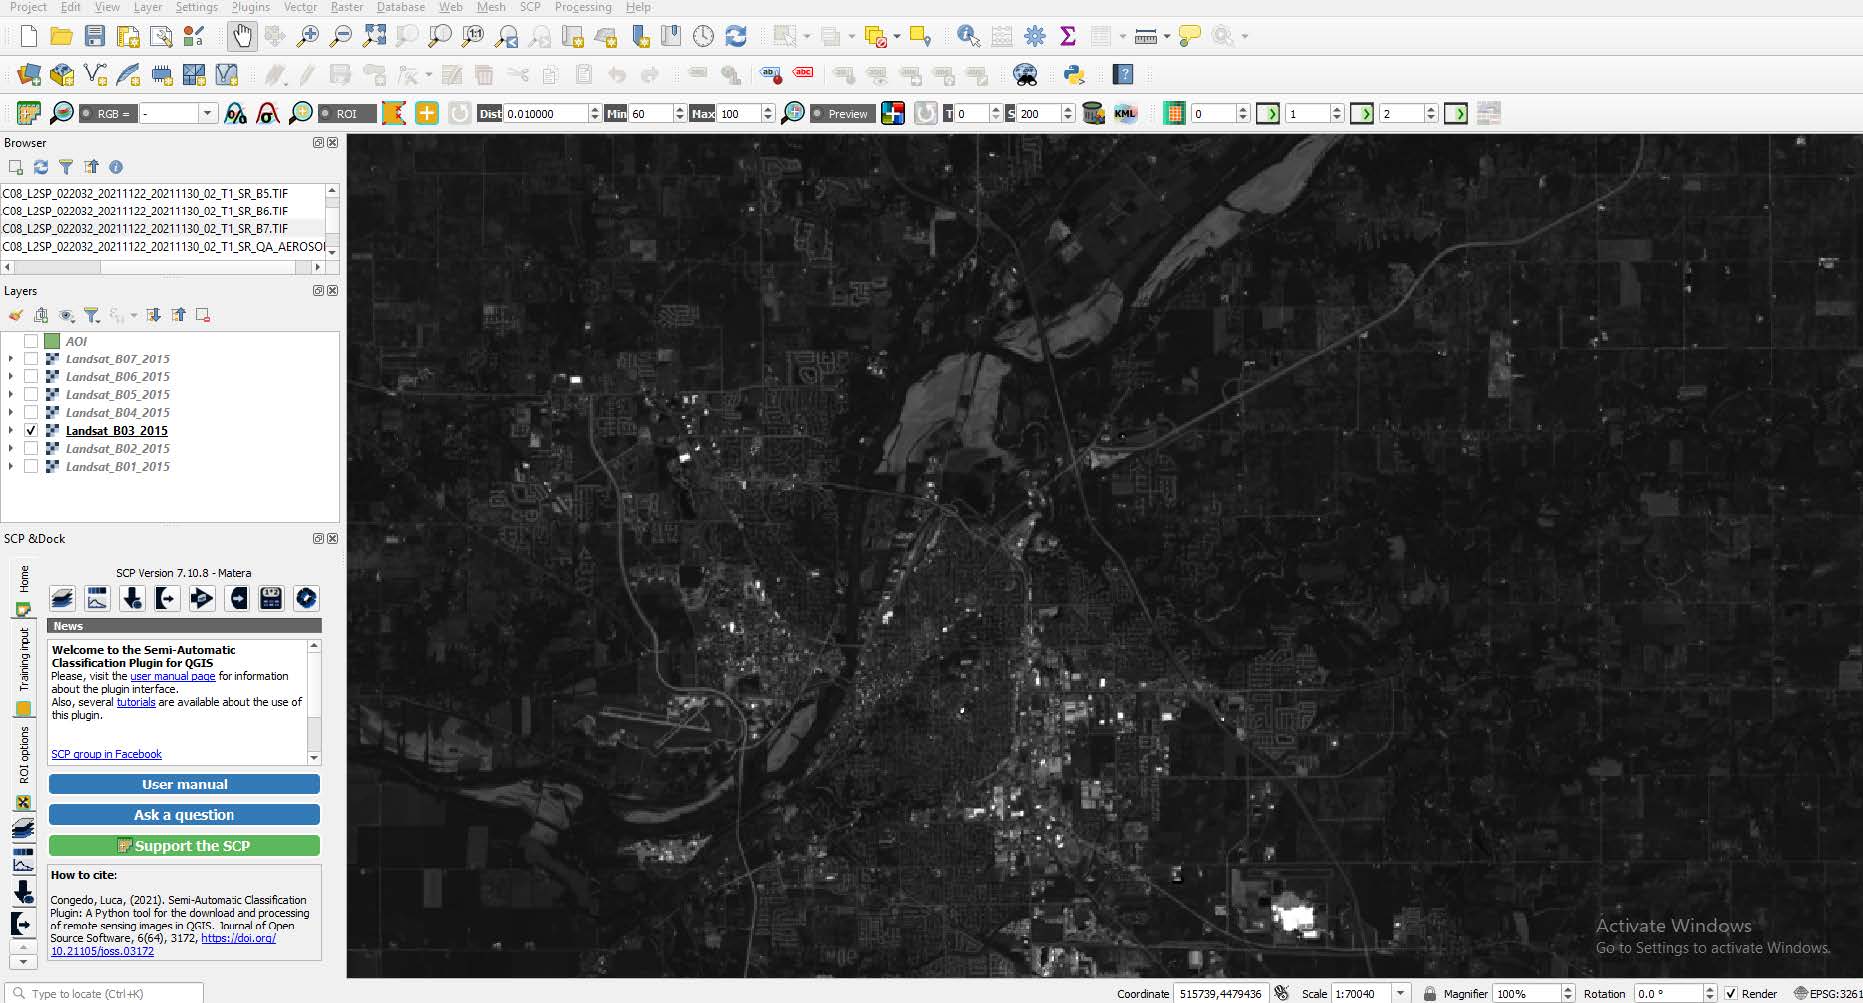
The downloaded Landsat satellite image can be imported into QGIS by navigating to the folder, where it is stored on the system using the QGIS Browser Panel and dragging the selected bands.
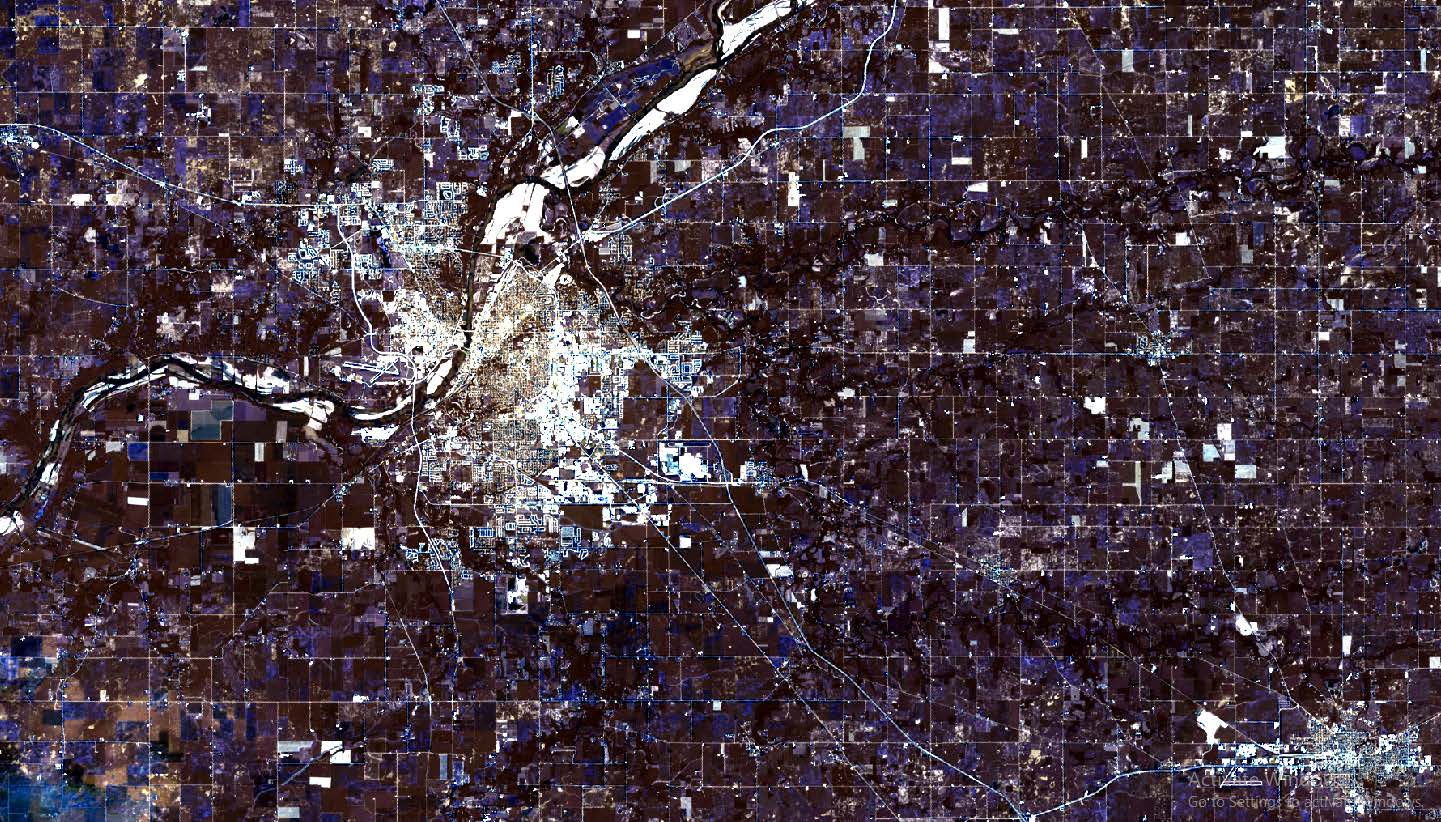
You can visualize the image, for this tutorial we will be using Band 1 to Band 7 of the Landsat data.
Working with SCP Plugin
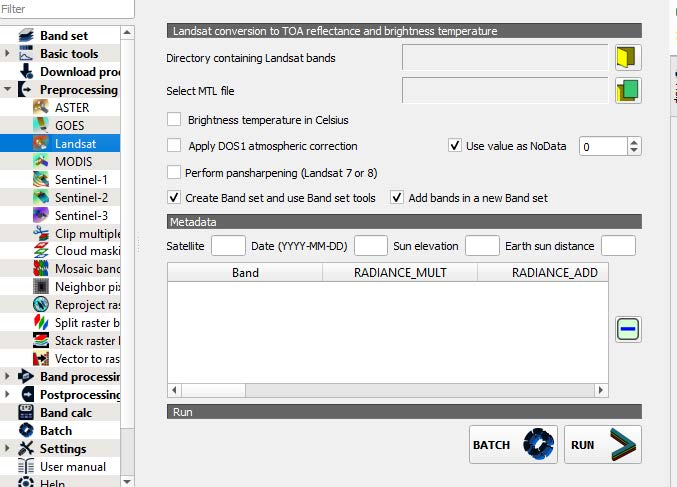
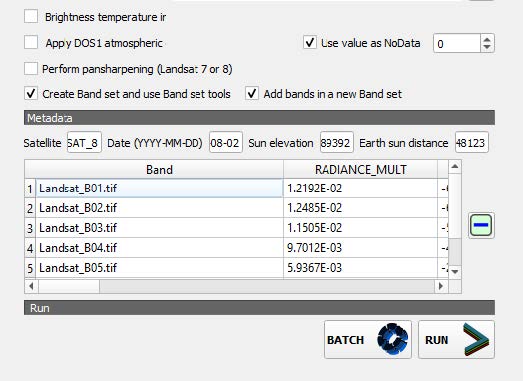
To perform all forms of analysis on the satellite image, we need to set the same directory where the images are stored within the Plugin. This is done by navigating to the SCP toolbar plugin and clicking on pre_processing. Since we are working with Landsat, select Landsat as the satellite data to work on.
Figure : Landsat 8 Pre-processing
Creating Bandset
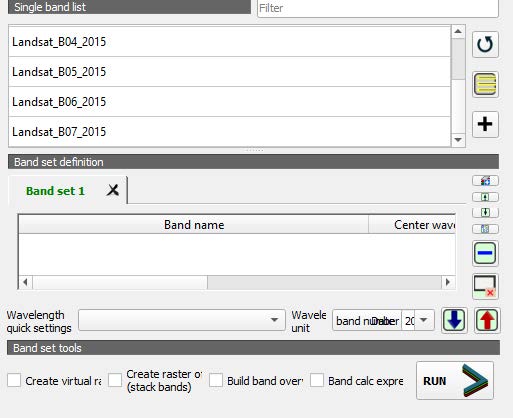
The individual bands that we have are not sufficient to run our classification algorithm. We need to create a bandset that combines all the information available in unique bands, to perform the image classification to produce LandCover for the different periods. To do this, navigate to Bandset within the plugin.
Click on the ![]() , this displays all bands available within the directory you have set, in previous
steps.
You can now add each individual bands, by clicking on the “+” sign. As specified previously, we
will be using Band 1 to 7, to create the bandset. After adding the necessary bands, click on
“RUN”. A prompt would appear to specify where to save the output. Ensure that every result or
output is saved in the same working folder, with self-descriptive names to avoid confusion with
other layers.
, this displays all bands available within the directory you have set, in previous
steps.
You can now add each individual bands, by clicking on the “+” sign. As specified previously, we
will be using Band 1 to 7, to create the bandset. After adding the necessary bands, click on
“RUN”. A prompt would appear to specify where to save the output. Ensure that every result or
output is saved in the same working folder, with self-descriptive names to avoid confusion with
other layers.
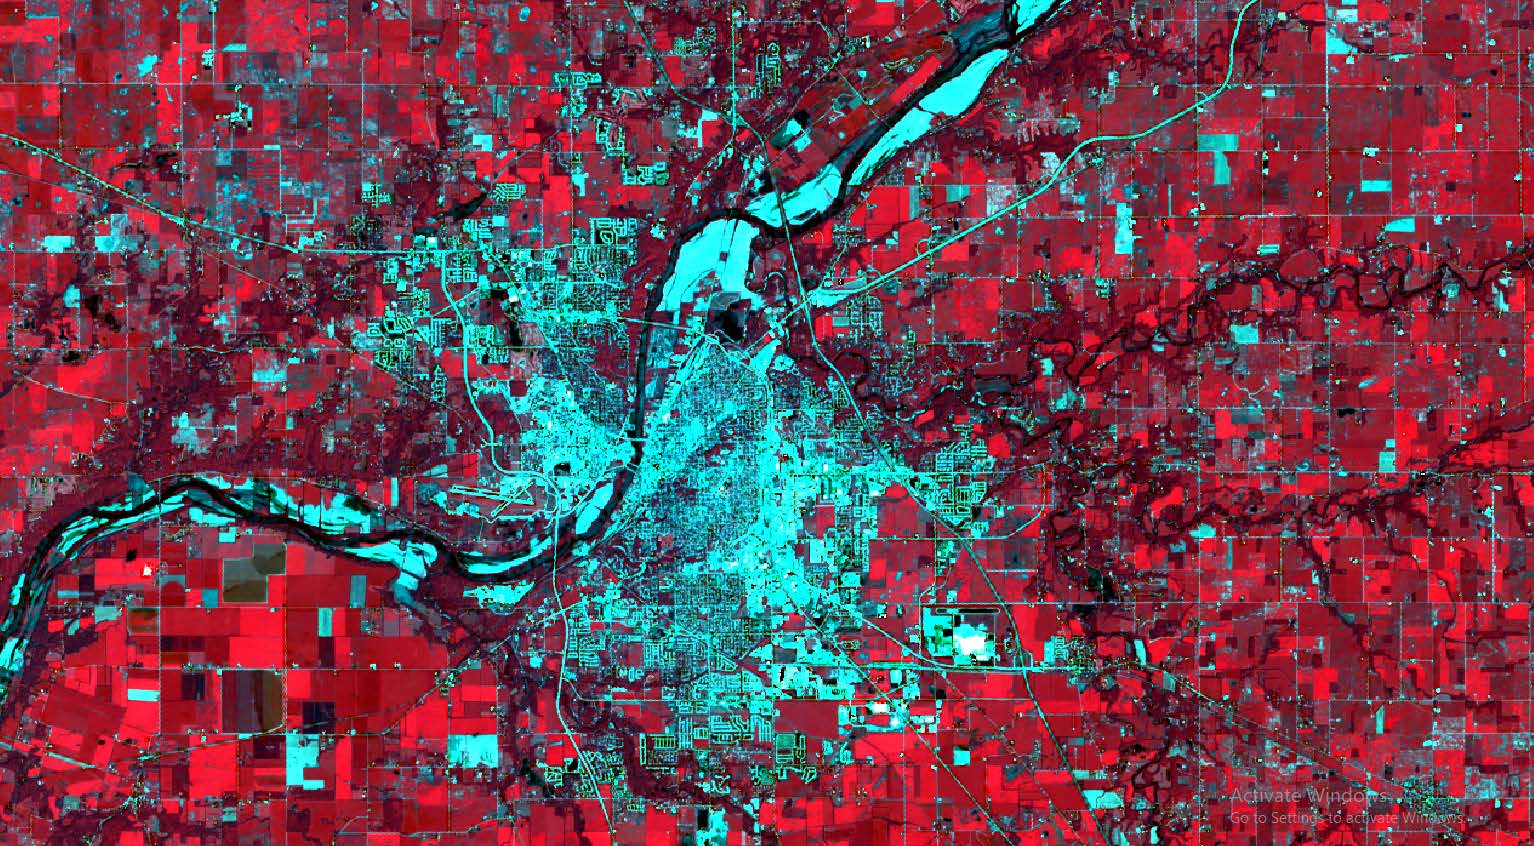
The resulting output band shows a multi-colored image, to highlight specific land cover types we can also change the band rendering. As seen in the image below, changing the rendering from 4-5-1 to 3-5-1 distinctively highlights vegetation cover.
Supervised Image Classification
For this tutorial, we will be using the Supervised classification technique, to produce distinct land cover maps for each year. In Supervised image classification, the user uses training samples representative of the object ground, to classify the image. The image is classified based on defined algorithms, such as minimum distance, maximum likelihood etc. The classes created are used to categorize the image into different classes
Training Inputs
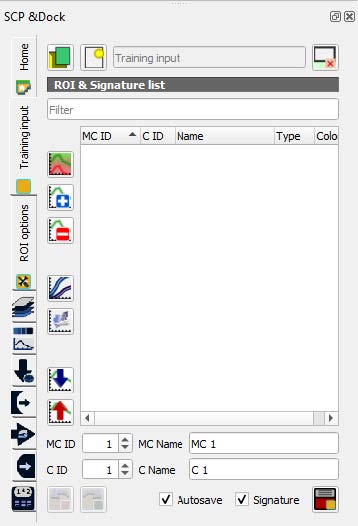
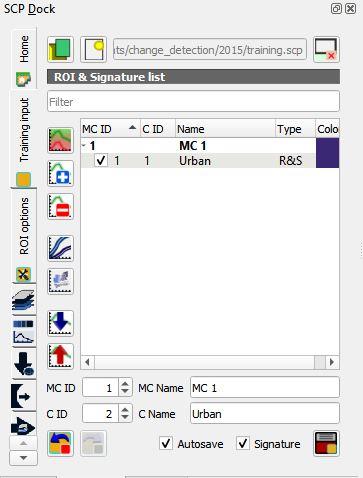
Training inputs can be created by navigating to the “Training Input” within the SCP dock. Create and save the training input file, within the working directory specified in the previous steps.
Training Classes
Determining the classes is primarily dependent on the user and the purpose of the study. For
change detection analysis, we want to ensure that the individual unique land cover for each
period contains similar land cover types, so as to effectively compare and detect change.
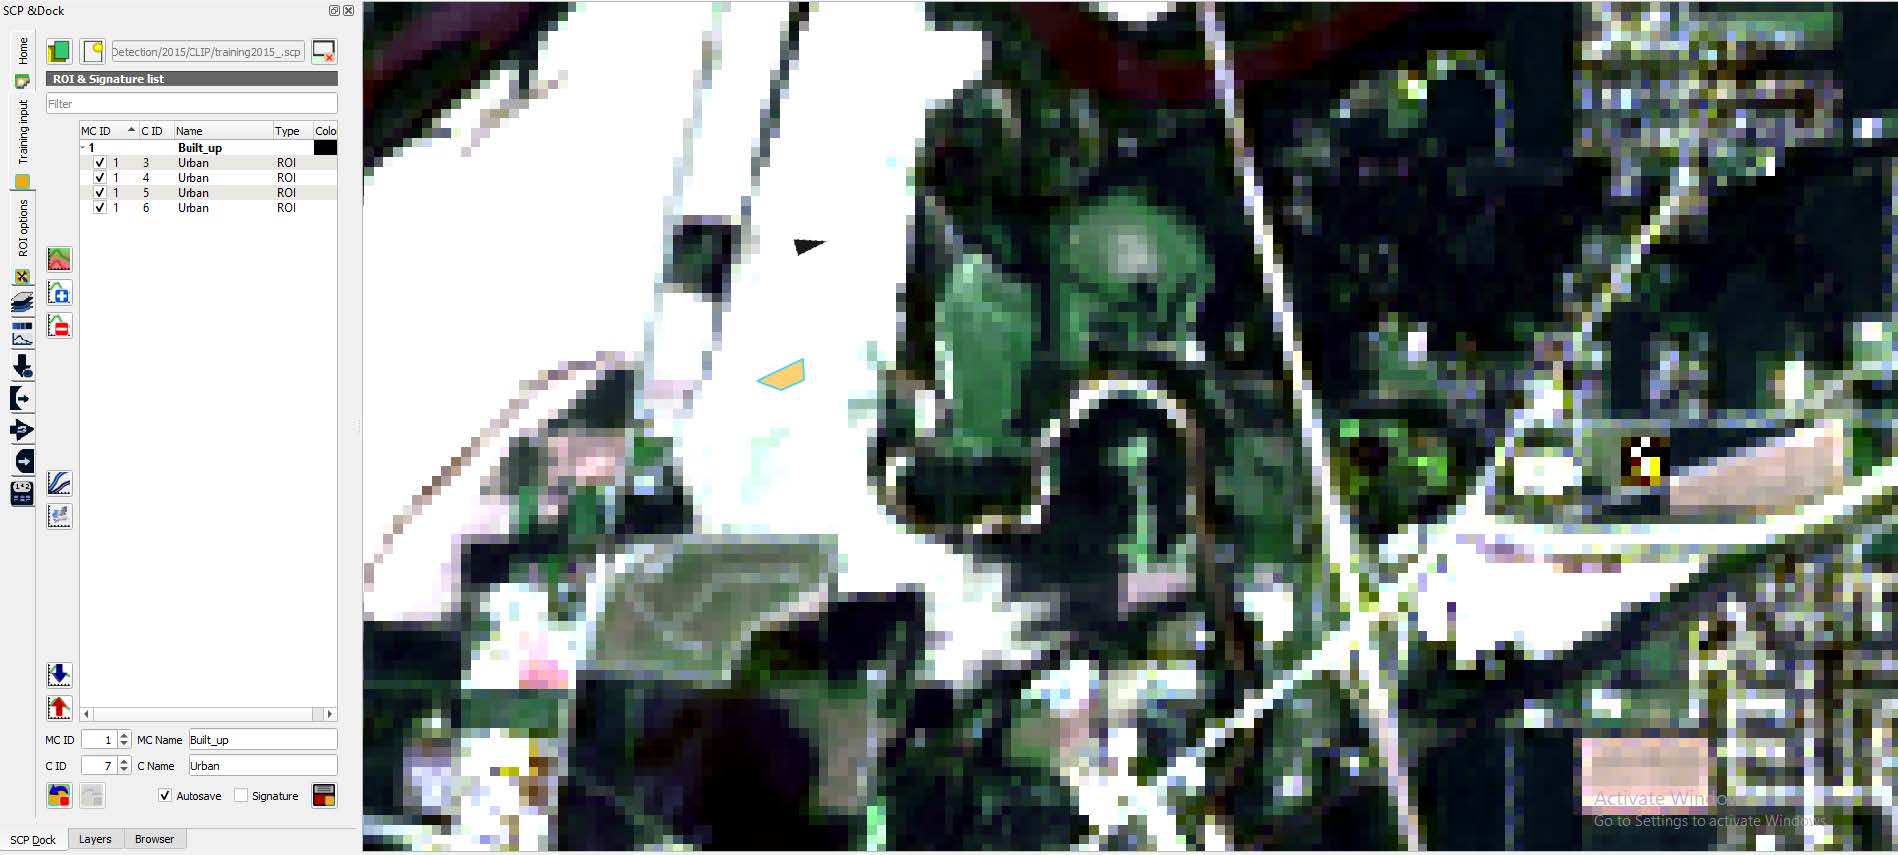
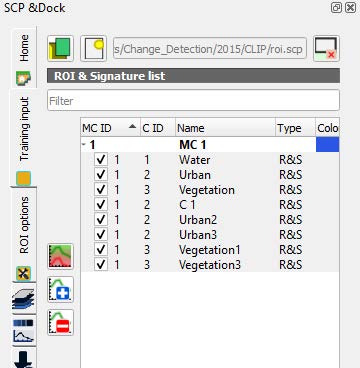
To create classes, navigate to the SCP dock, and click on the ![]() icon, name and save the
training input accordingly. For each unique class, ensure that the “C ID” is uniquely descriptive
of individual classes. Also name the class respectively, Agriculture, Urban and Water Body.
icon, name and save the
training input accordingly. For each unique class, ensure that the “C ID” is uniquely descriptive
of individual classes. Also name the class respectively, Agriculture, Urban and Water Body.
Draw polygons within respective classes, ensuring the polygon is fully contained within the pixel representing the classes, to ensure accuracy and precision of the result.
It is advisable to create multiple training inputs for each class.
Click on the ![]() icon, to create “ROI”. To save the created class.
icon, to create “ROI”. To save the created class.
Save the respective classes, by clicking the![]() . Ensure that each is saved with well-descriptive
names, and the autosave and signature boxes are ticked.
. Ensure that each is saved with well-descriptive
names, and the autosave and signature boxes are ticked.
Assessing the Spectral profile of the Classes
To ensure that distinct classes are not confused together, we need to quantitatively assess the
spectral signatures of the classes.
Highlight all the classes created, then Click on ![]() to add calculate signatures for the
highlighted classes. After running that successfully, click on the
to add calculate signatures for the
highlighted classes. After running that successfully, click on the ![]() to add highlighted
signatures to the spectral signature plot. Ensure that all classes are highlighted.
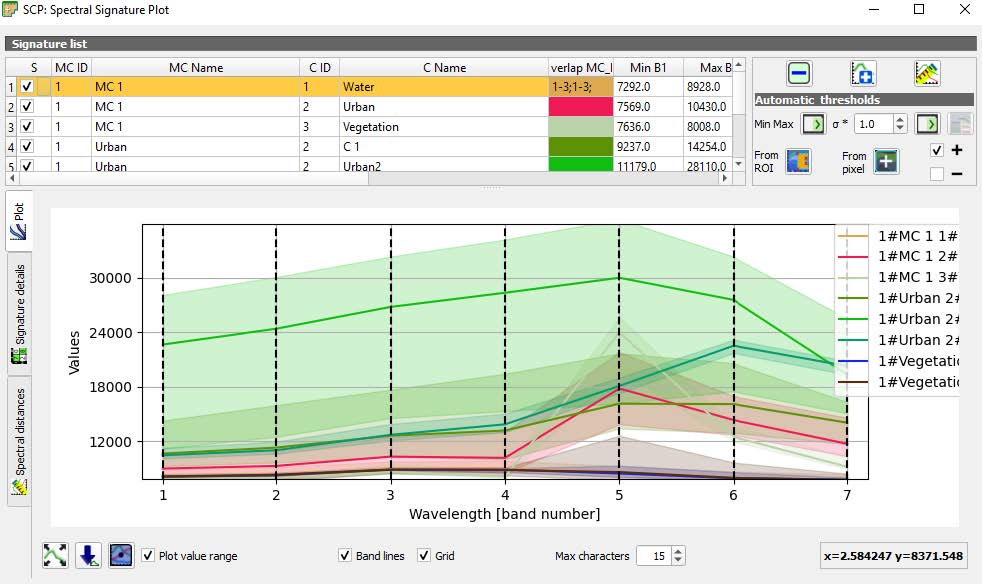
It produces a spectral plot as seen in the image below.
to add highlighted
signatures to the spectral signature plot. Ensure that all classes are highlighted.
It produces a spectral plot as seen in the image below.
The spectral plot shows a visual representation of the training samples across the wavelength of the bands. Each included band is represented as the vertical dotted line running across the plot. We can clearly see that the classes are mixed with each other, this form of training input will produce wrongly classified pixels. We can, therefore, edit our classes, to reduce this confusion between classes to ensure higher accuracy
Classification
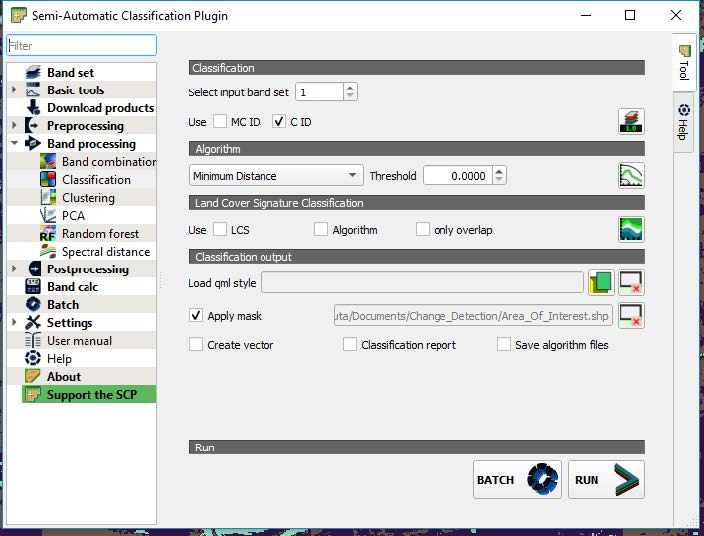
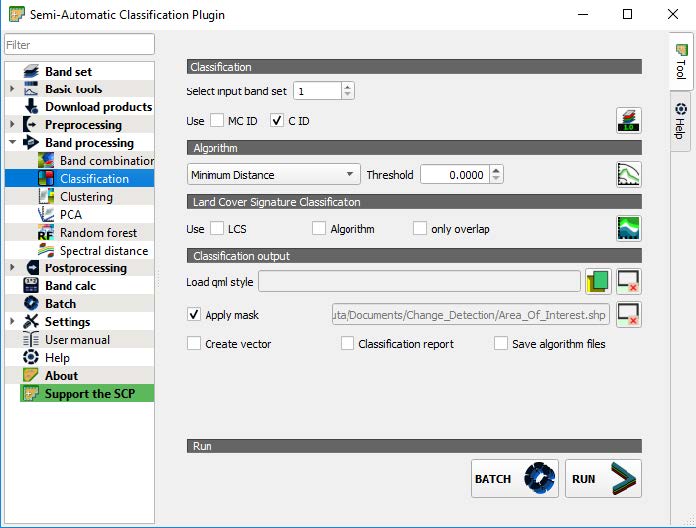
We can now run the classification after ensuring the classes are adequately and correctly selected. Navigate to the “Classification” tab which can be found either within the DOCK or the SCP plugin toolbar.
Since we are using the “C ID”, ensure that the “C ID” is ticked. The plugin has three algorithms for classification, “Minimum distance”, “Maximum Likelihood” and “Spectral Angle Mapper” . The minimum distance algorithm calculates the distance between the mean of spectral signatures of the band and the value of each pixel is calculated band per band. The maximum likelihood classifier classifies an image by calculating the statistical probability of individual class signatures. Lastly, the spectral angle mapper classifies the image based on the spectral angle of the pixels.
To ensure that the result produced is solely for the Area of interest demarcated, we would check “Apply mask” then Click on the “RUN” button, it produces a prompt specifying where the output should be saved. You can also try other algorithms apart from the Minimum distance algorithm used here, such as the Maximum Likelihood and Spectral Angle Mapper. Also the thresholds can be edited too.
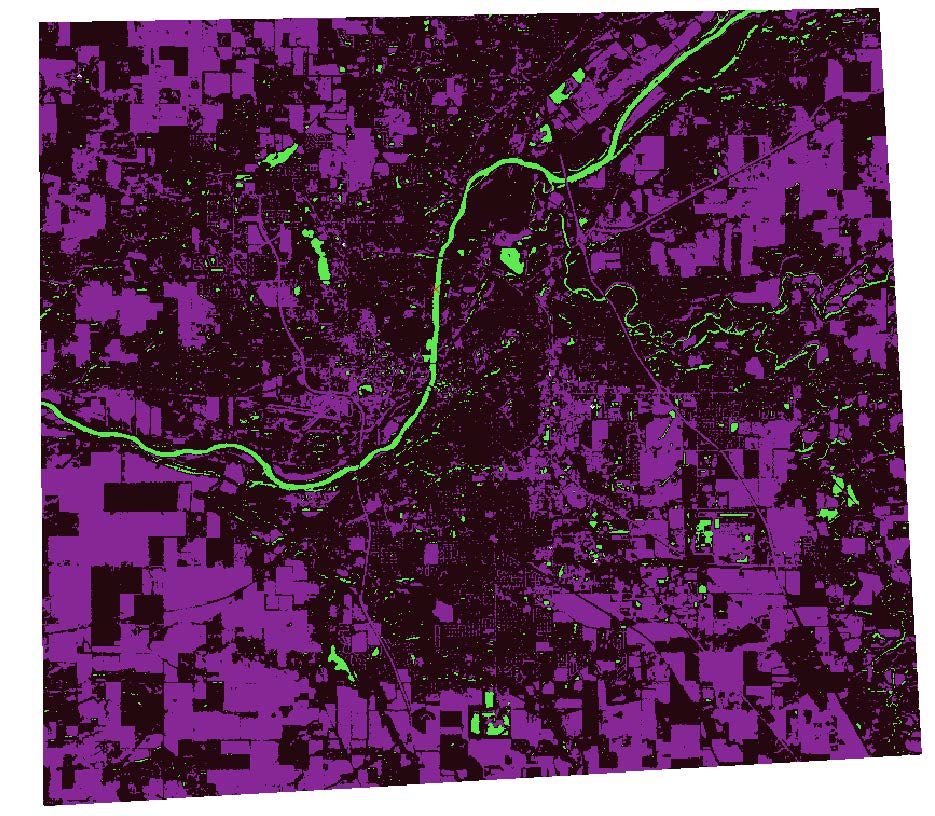
The land cover image above was produced for 2015. You can also repeat the same steps above for the year 2021. Ensure that new ROIs are created for the subsequent year.
Detecting the Land cover change
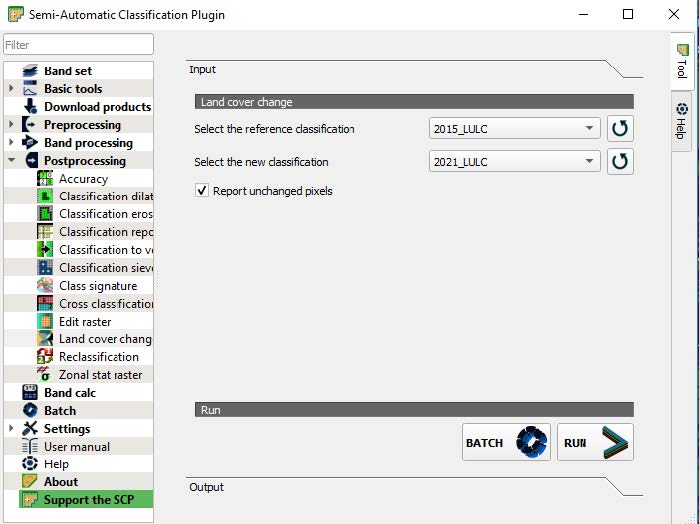
After following the steps and creating the land cover maps. We now have two distinct land cover maps for years 2015 and 2021 respectively. To observe the notable changes between the two years, navigate to the SCP panel, and click on post-processing and Land cover change.
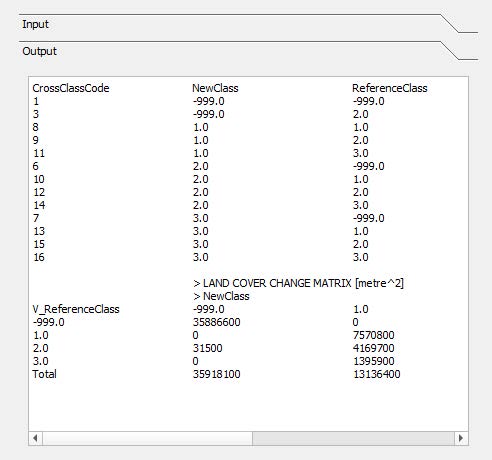
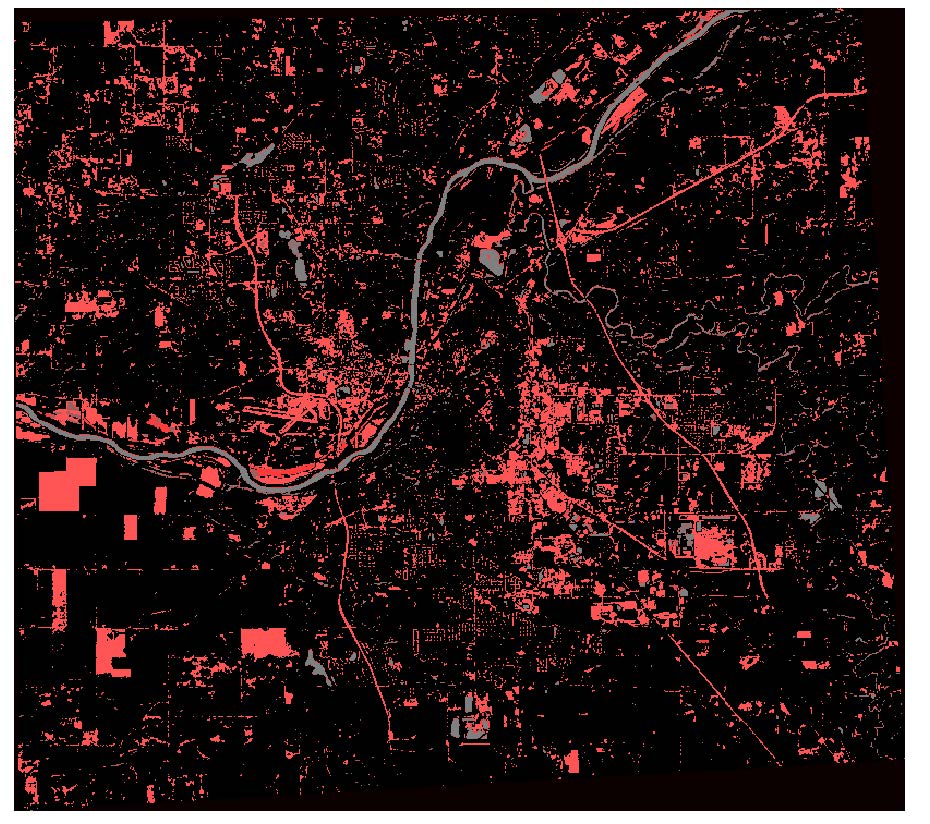
Within the Land cover change panel, the reference layer is the old classification layer which here is the 2015 Land cover while the new classification is the new land cover, which is the 2021 layer. Ensure the unchanged “Report unchanged pixel” is ticked also. Click “RUN”... The Land cover change tool produces an image depicting changes in the layer and a table showing the pixels that have been transformed from one class to another.
Conclusion
QGIS has been adequately equipped with features and plugins that support seamless remote sensing and GIS analysis. The semi-automatic classification plugin (SCAP) plugin provides capabilities to support preprocessing and post-processing of satellite images. Although this tutorial uses the minimum distance algorithm to classify the image, you can also experiment with other algorithms such as the maximum likelihood and spectral angle mapper to produce desired classification results. We can highlight specific classes to understand the change. Studying a topic such as deforestation, the vegetation cover between the two periods can be compared. Also urbanization and the rate of urban growth can be directly studied by comparing total extent of urban areas between the periods.
