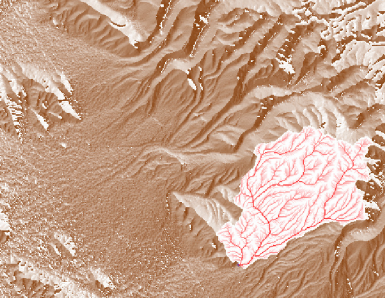
Terrain analysis for urban storm water modelling using Mapwindow in Surrey
Contents
Disclaimer
This Wiki has been produced for the GEOM4008 Advanced Topics in Geographic Information Systems course at Carleton University. It is a tutorial to showcase the methods of calculating and illustrating the effects of terrain analysis for urban storm water modelling using Mapwindow in Surrey. This tutorial should aid in the user's ability to replicate the results shown using Mapwindow's plugins and tools.
Preamble
Introduction to Mapwindow
Mapwindow is an opensource software which is includes a ready-to-use spatial data viewer and a geographic information system which can be modified and extended using plugins. The open source software will be exclusively used is MAPWINDOW along with the Hydro Desktop application. MAPWINDOW is able to accurately illustrate watershed delineation in 3D by using the available plugins. HydroDesktop is an open source software package written in C# that allows the users to find the time series of water and climate data submitted by the hydrologic research community and other experts around the world. The data that is produced by HydroDesktop can be used in analysis software such as R, MATLAB, and Excel. The MAPWINDOW toolset will be used to illustrate and query hydro-geomorphological features in the catchment areas with Surrey.
Definitions
- Catchment area
- Area from which water flows into a lake, river, or other water system.
- Storm water runoff
- The changes in the hydrological cycle due to paved streets and buildings which speed the delivery of both water and pollutants to waterways (Columbia, 2005). This means that as areas become more urbanized, i.e. have more pavement or concrete, that there will be more runoff due to the lessened amount of infiltration. In addition to higher peak rates during stormflow, the amount of pollutants will be increased, as the pollutants will be introduced directly into the stream and will not have time to be adsorbed into the ground.
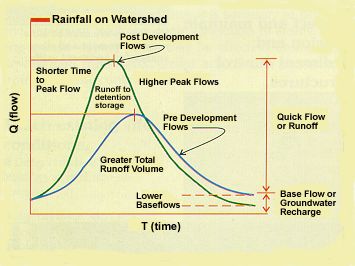 Figure 1. How streamflow changes with urban development (Ministry of Water, 2005).
- Watershed
- A watershed is a catchment area that drains into a marsh, stream, river, lake, or into ground water and can range in size from a few acres to millions of acres ("What is a Watershed?", n.d.). \
- Digital Elevation Model (DEM)
- A DEM is the graphical representation of the topographic relief of the study area.
- Hydrogeomorphological
- Interactions between the hydrologic cycle and the landforms of the Earth.
Tutorial
Introduction
This project will focus on the watershed delineation of Surrey, BC to construct a feasible urban storm water model. The project will use the watershed delineation plugin and its six DEM processing functions to delineate watersheds as well as illustrate and query hydrogeomorphological features in the catchment areas of Surrey. This tutorial will provide new users with the information required in using Mapwindow to be able to effectively conduct watershed delineation analyses using raster data.
Data
The first step is to download a fully processed DEM for the region you are interested in. The data that was used in this project was obtained from the City of Surrey Open Data website (http://data.surrey.ca/) and the Geogratis (http://geogratis.gc.ca/) website.
The following data was downloaded:
- catchments
- detention ponds
- devices
- laterals/connections
- mains and culverts
- manholes
- nodes
- offset lines
- open channels (ditches, creeks, rivers)
A hydrography surface model (CDSM) should be downloaded from http://geogratis.gc.ca/.
Methods Conducted Using Mapwindow
Download the software
Before starting you will need to download the software. Mapwindow is found at http://www.mapwindow.org, and HydroDesktop can be found at http://hydrodesktop.codeplex.com/.
Mapwindow Setup
Firstly, download the files to your working directory, and ensure that Mapwindow is properly installed and functional. Secondly, you need to specify in Mapwindow which projection the data is using. For this project the data is projected in Geographi NAD83, and can be set using the following steps
To do this go to botton left corner and choose projection. 
Click on the Project → New tab to open a brand new project.
Figure 2: Opening new project in Mapwindow
Import DEM and Watershed Delineation processes
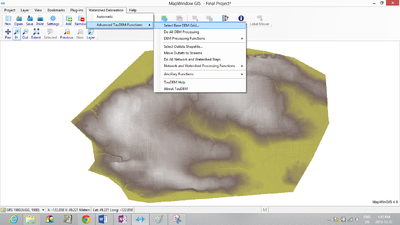
• Select the DEM. Go to Watershed Delineation → Advanced TauDEm Functions → Select DEM
Figure 3: Opening DEM
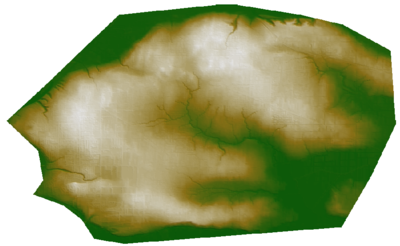
• Fill the pits. Watershed Delineation → Advanced TauDEm Functions → DEM Processing Function → Fill Pits
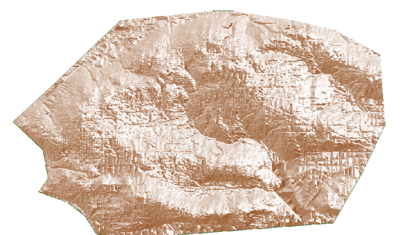
Pits are the cells surrounded by higher elevation cells which could interfere later on during the routing process. Pits are identified by removing and raising its elevation to the lowest one around its edge.
Figure 4: DEM with pits filled
• Next you will need to get the flow directions D8. This process generates two grids where the first is the slope in the steepest descent direction, and the second contains the flow direction from each grid cell to one of its adjacent or diagonal. This is calculated using the direction of steepest elevation difference with the 8 neighboring cells (Man,2011).
Watershed Delineation → Advanced TauDEm Functions → DEM Processing Functions → D8 Flow Direction
Figure 5: Flow direction grid
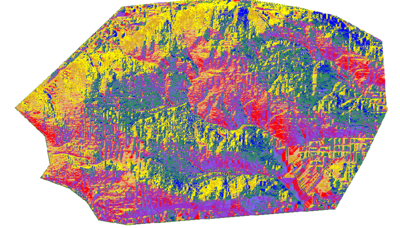
• Next, Watershed Delineation → Advanced TauDEm Functions → DEM Processing Functions → Dinf Flow Direction This assigns flow direction based on the D-infinity flow method using the steepest slope of a triangular facet. The flow direction is the steepest downward slope on planar triangular facets on a block centered grid (Man, 2011).
Figure 6: Flow direction
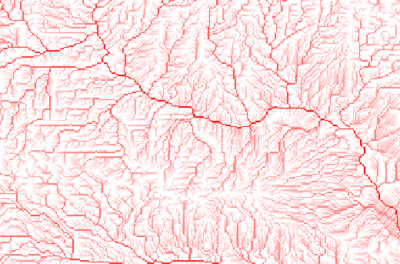
• Watershed Delineation → Advanced TauDEm Functions → DEM Processing Functions → D8 Contributing Area
Figure 7: DEM of contributing areas
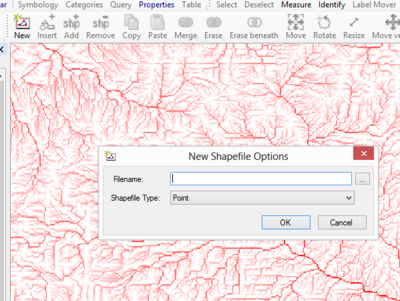
Then, verify that the shape file editor is selected , (Plug-ins → Shape file editor)and select new to create new shape file and click in the cell that will be the outlet.
Figure 8: New point shapefile
Now a pop-up will appear that an empty shapefile was created. Accept and press OK. Now zoom to the where the outlet is to be created, click on add new shapefile, and click in the outlet cell.
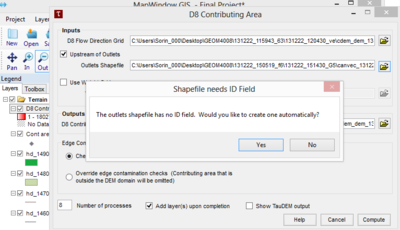
• To illustrate the contributing area, go to Watershed Delineation → Advanced TauDEm Functions → DEM Processing Functions → D8 Contributing Area
Select Check the box Upstream of outlets and go to the folder and file of the created outlet. Accept any pop-ups.
Figure 9: Steps to creating contributing area
Catchment Area
This illustrated the contributing area as the outlet’s own contribution and the up-slope cells which drain in to it.
Figure 10: Contributing area (source: Man, 2011)
The contributing area calculates a grid of the specific catchment area. The D- infinity approach is used, which is the steepest downward slope on planar triangular facets on a block centered grid (Man, 2011). The contributing area of each grid cell is added to the the contribution from the up-slope proximities.
You should be able to generate grids above which result in the calculated fill pits , flow directions and contribution areas for Surrey, BC.
Sources
Columbia, G. o. (2005, May). Water Quality. Retrieved from Environmental Protection Division: http://www.env.gov.bc.ca/wat/wq/nps/NPS_Pollution/Stormwater_Runoff/sw_main.htm
Man, V. (2011). Watershed Delineation with MAPWINDOW. Retrieved from mapwindow.org: http://www.mapwindow.org/apps/wiki/lib/exe/fetch.php?media=mapwindow_watershed.pdf
Ministry of Water, L. (2005). Stormwater Runoff. Env.gov.bc.ca. Retrieved 20 October 2017, from http://www.env.gov.bc.ca/wat/wq/nps/NPS_Pollution/Stormwater_Runoff/sw_main.htm
What is a Watershed?. Watersheds101.ca. Retrieved 20 October 2017, from http://watersheds101.ca/learn-about-watersheds/what-is-a-watershed
