User:FalconWing09
Contents
- 1 Sea Level Rise Analysis Quantum GIS Tutorial
- 2 Open new ArcGIS Desktop project, ArcMap and the Arc Catalog window
- 3 Open Quantum GIS
- 4 Open Layers Plugin
- 5 DEM Sea Level
- 6 The result
- 7 DEM sea level rise 10m
- 8 Skip LiDAR analysis in ArcGIS Desktop
- 9 DEM Sea Level Rise Analysis using Quantum GIS
- 10 Thank you for participating in this tutorial
Sea Level Rise Analysis Quantum GIS Tutorial
To install Quantum GIS Download from www.qgis.org Install Quantum GIS 2.12 Lyon on Windows 10 or earlier versions of windows Once installed, secondary data will need to be downloaded. Use Geogratis to search for secondary vector data. Identify study area using Geogratis Search Download Nanaimo region data including canvec_092B.zip, canvec_092C.zip, canvec_092F.zip and canvec_092G.zip Download the feature identification PDF file Download LiDAR data from GeoBC Browse for GeoBC and head to http://www.nanaimo.ca/ortho/ Identify study area using the satellite map for Area A Download Nanaimo region ortho LiDAR data, 452D.las, 453.las, 552B.las, 552D.las, 553A.las, and 553C.las
I recommend downloading the latest version, as I found they tend to have fixed some of the problems of the earlier versions. Go to your download folder located on the C drive. Thankfully windows has now made it easier to find your downloads. You can either open the downloads folder by opening the folder icon on the windows task bar or in Windows 10 simply search for your download using the search bar. I am talking about data in terms of primary and secondary, because primary is data that you collect yourself and that you own. While, secondary data is data from an outside provider that has already been built, but can have restrictions on use. I searched for British Columbia, initially but eventually searched for data on Vancouver Island, this resulted in better search results. Each page will have to be opened to download the data. There are other download options as well including: Meta data, tables and PDF files. GeoGratis has a copy of the feature identification file in every vector page, you only need to download one of them. It will also be useful for identifying each feature individually. The LiDAR data will come in handy later when conducting terrain analysis, and sea level rise analysis.
Open new ArcGIS Desktop project, ArcMap and the Arc Catalog window
Create appropriate folders to contain data, put master folder on C drive direct and sub folders in this folder Add the downloaded canvec files to the ArcMap table of contents (TOC) Open the feature identification PDF file in a separate window Look at the identification numbers Enter identification numbers in the PDF search Rename the shapefile with the appropriate identification (Name of the feature with the number and identification number!) Example: AboriginalLands1690009_092B Do this for each shapefile Once complete, export features to shapefile, ready to import into Quantum GIS
Put the feature identification PDF file window beside the ArcMap window. This will speed up the identification process. Click edit in Adobe Reader and click search. Remove any shapefiles that will not be used for the sea level rise analysis. Adobe will look for the number and give you the correct land identification for that number. Renaming will help you understand which region each shape file belongs, preventing confusion. To save you time, I suggest you remove most points and lines with exception of contours, roads, rivers, etc. Keep important features. You will be coming back to ArcGIS Desktop to do some LiDAR work later.
Open Quantum GIS
Reproject each shapefile from their original format to the BC Albers projection using the reproject tool in Quantum GIS. Add each projected shapefile to Quantum GIS table of contents. Example:
Toggle layers on and off as desired Change the symbology to best represent features (i.e. roads, rivers, buildings etc.)
Open Layers Plugin
Download and install open layers plugin in Quantum GIS Select Google satellite as the online layer to use Move the Google satellite layer to bottom of the table of contents with the other layers on top
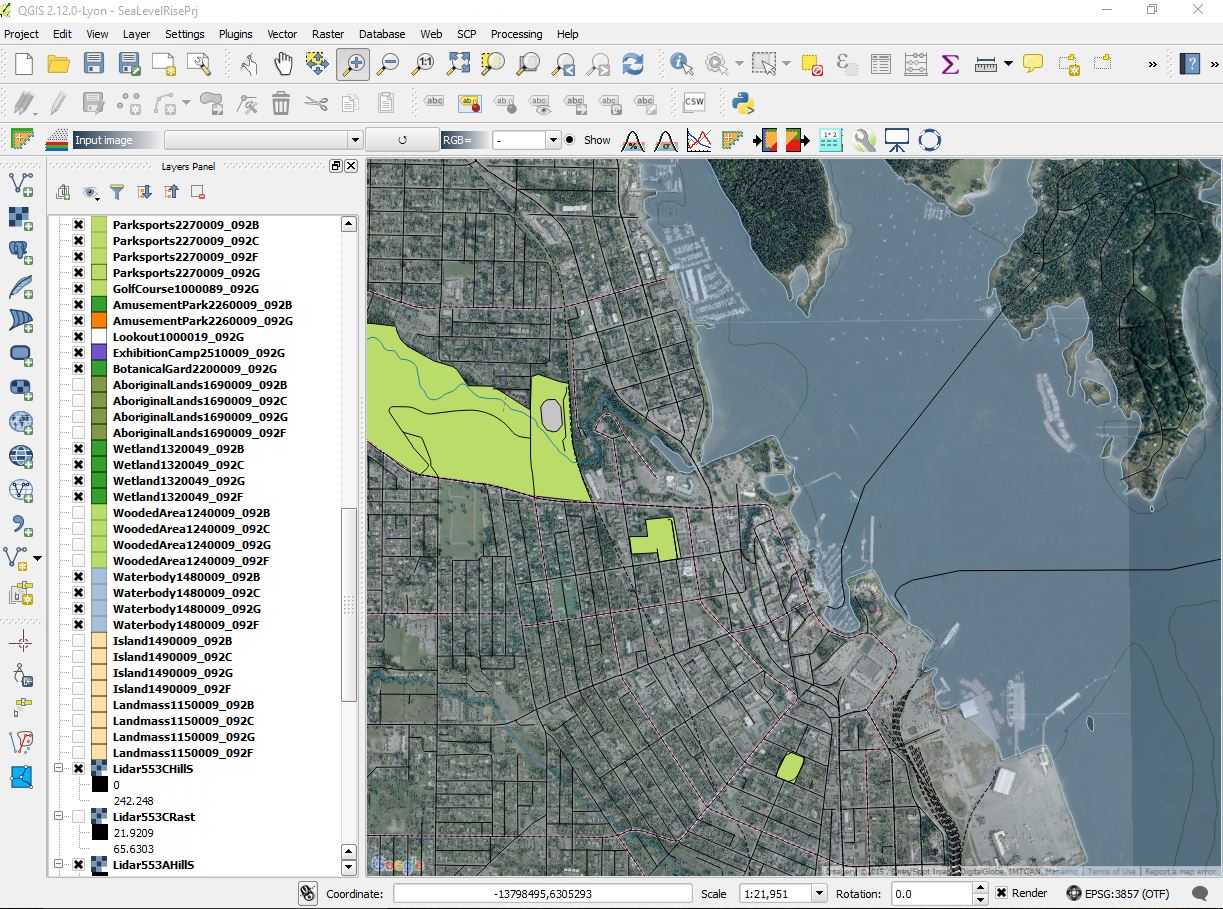
The example above shows the Google Satellite view. This is helpful for identifying features, buildings and the general area of Nanaimo. Turn on important layers.
DEM Sea Level
Download a Digital Elevation Model (DEM) from GeoGratis As before use GeoGratis search to identify area and download the 092g04_e.dem and 092g04_w.dem from the GeoGratis 092g FTP site Move download to a separate sub folder under the master folder Add the DEM to the Quantum GIS table of contents If you want you can select a smaller area by using the raster mask tool
Nanaimo 3m sea level rise
Open raster calculator and input the example expression below
What you want to do is to perform a raster calculator calculation that will determine the sea level based on the variable input. I will start with a 3 meter sea level rise.
This creates a DEMSeaLevel3m raster Modify the symbology to better represent sea and land mass Right click the layer in the table contents and choose properties, style.
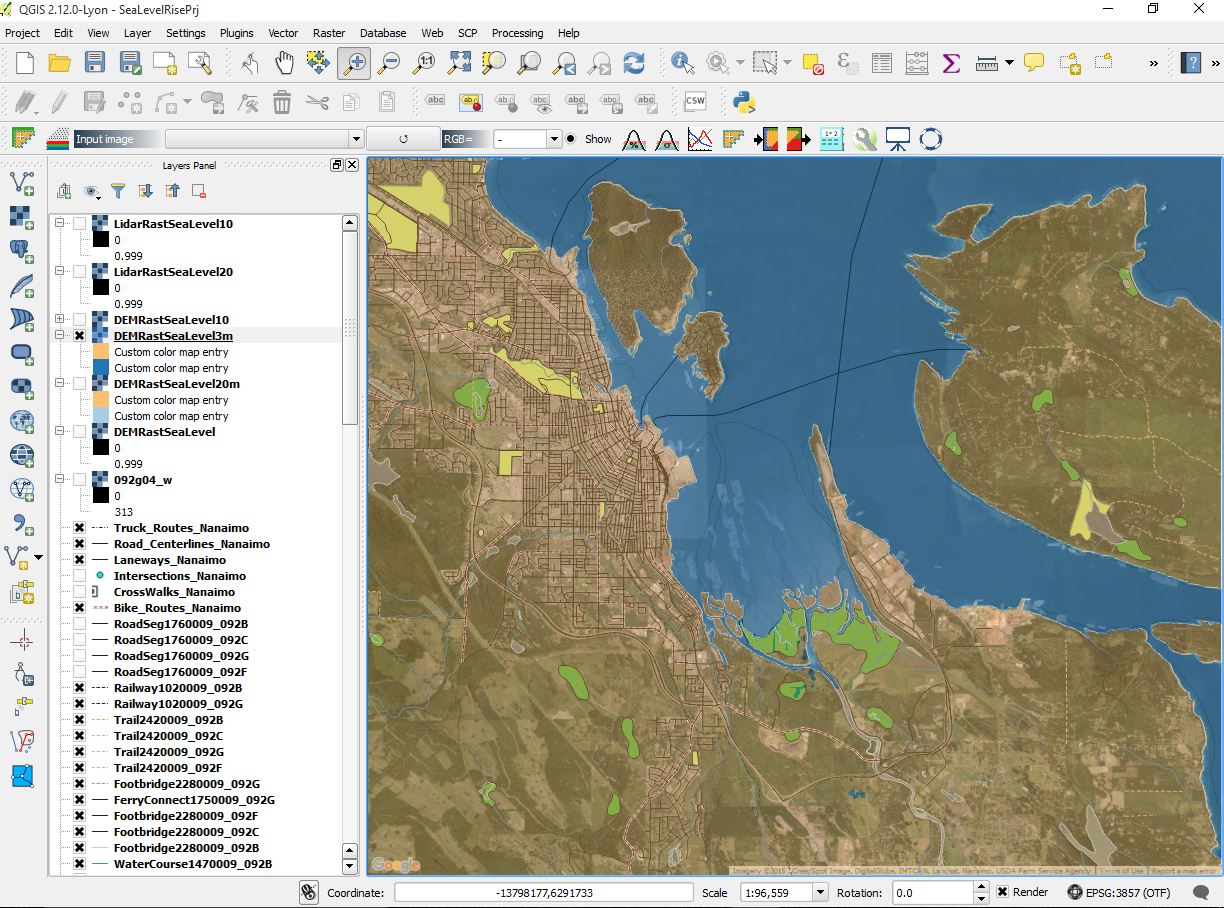
As you can see from the image above, the areas in white are representing sea level rise while the dark areas are existing land masses. The visual representation here could be better formatted. Change the symbology, for example use ocean blue to represent ocean and yellow or medium yellow to represent land mass.
Change render to Singleband pseudocolor
This is done by changing the render type to singleband psuedocolor and adding two or more colors that are representative of sea level inundation and land mass. You can add other colors based on the different levels of elevation, but for your purposes 2 colors will suffice for this tutorial.
The result
Below, a map showing appropriate symbolization is shown.
DEM sea level rise 10m
As before repeat the above steps for calculating a 10m sea level rise and apply appropriate symbology
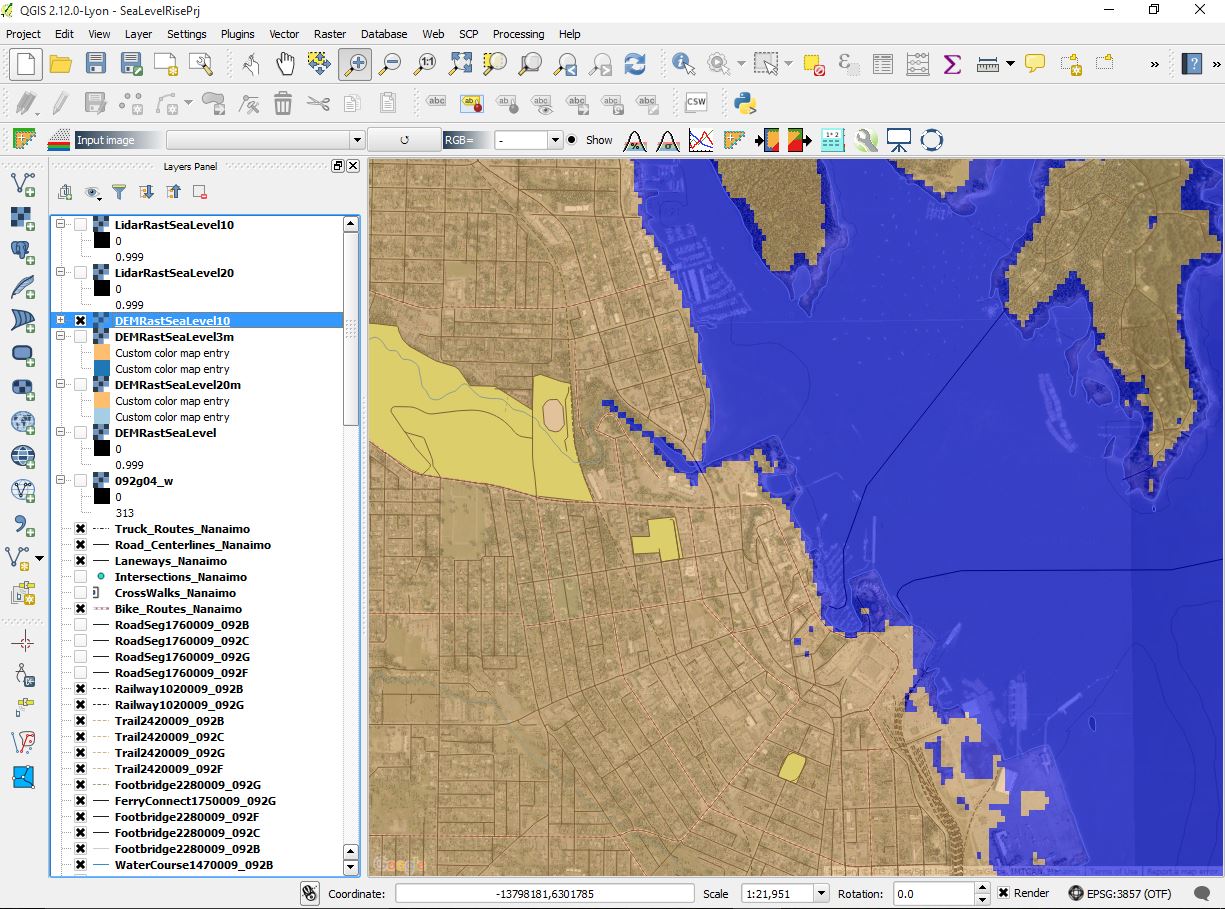
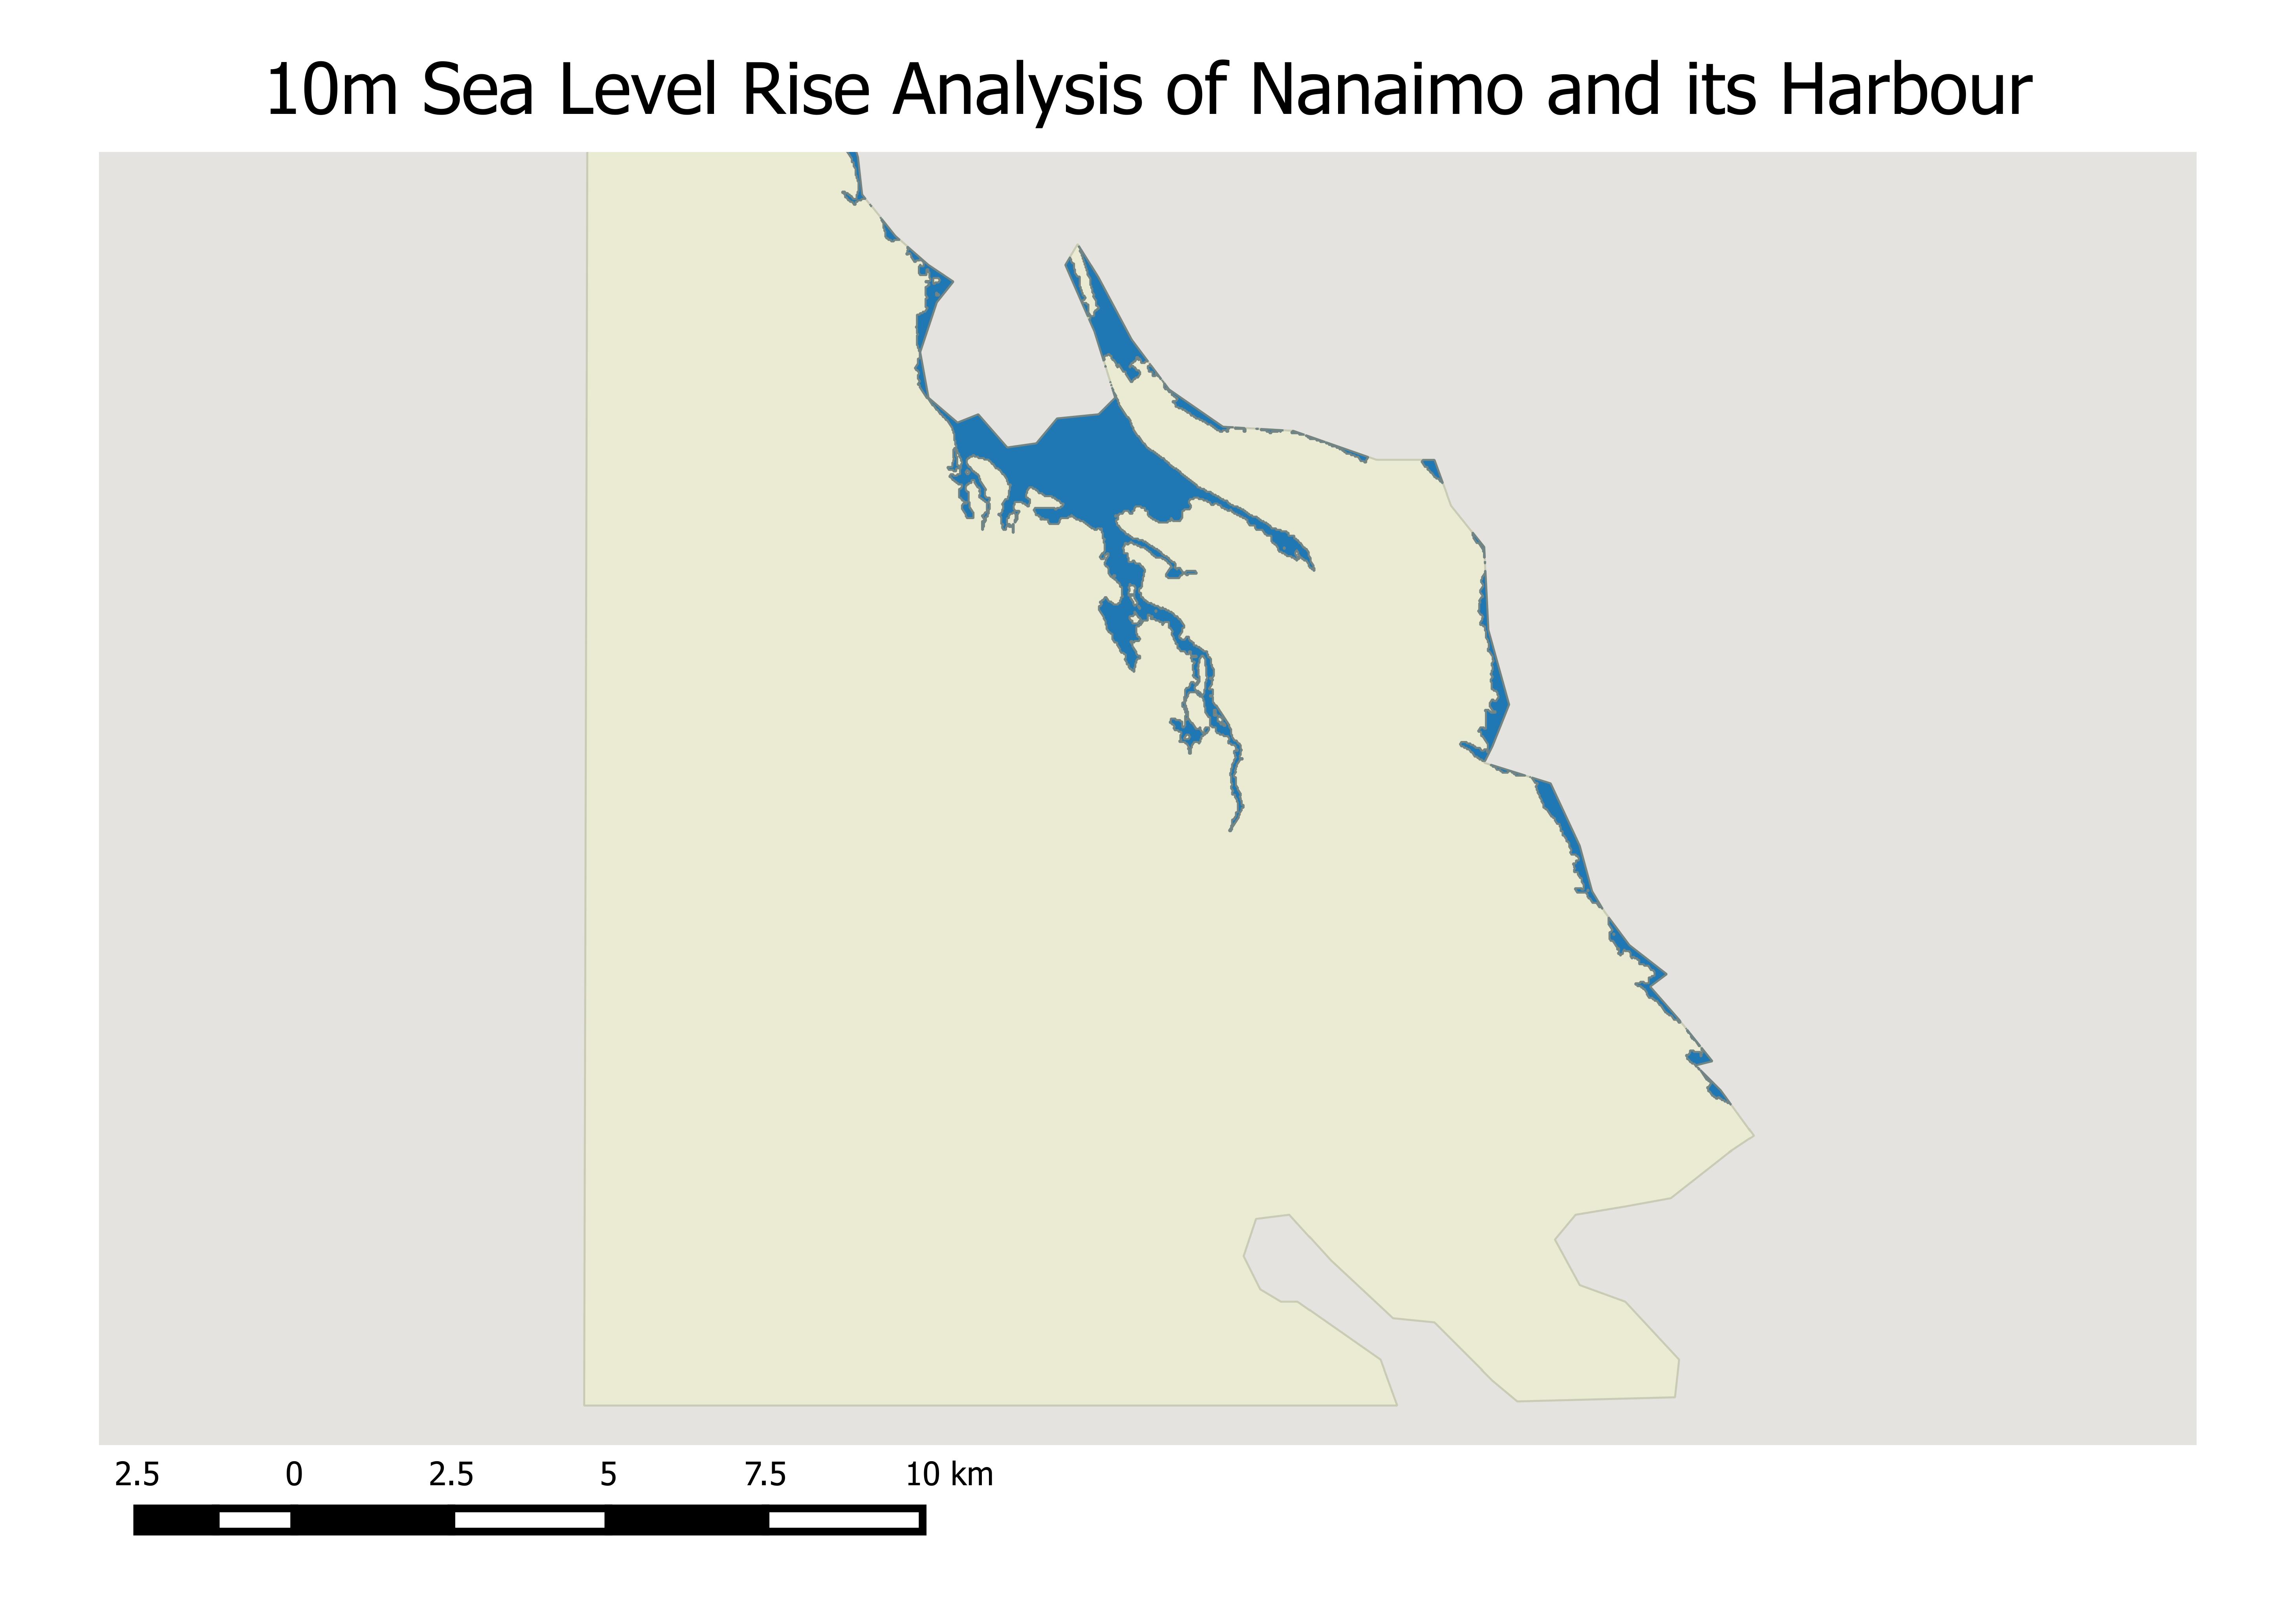
Result below
From the image above, we can gather there is a significant impact on the Nanaimo harbour area from a 10m sea level rise. Most of the harbour area has been flooded.
Skip LiDAR analysis in ArcGIS Desktop
DEM Sea Level Rise Analysis using Quantum GIS
The first step is to use the existing 3 and 10m calculated sea level rise images and convert them to polygons. This is done using the Raster Polygonize tool in Quantum GIS. The resulting images DEMRastSeaLevel3P and DemRastSeaLevel10P are created.
What is needed is a polygon representing the sea. To do this select the portion of the polygon that represents the sea, and create a new layer shape file under layer tools in Quantum GIS from the selected polygon.
Digitize the study area, as this will be used for the intersect operation.
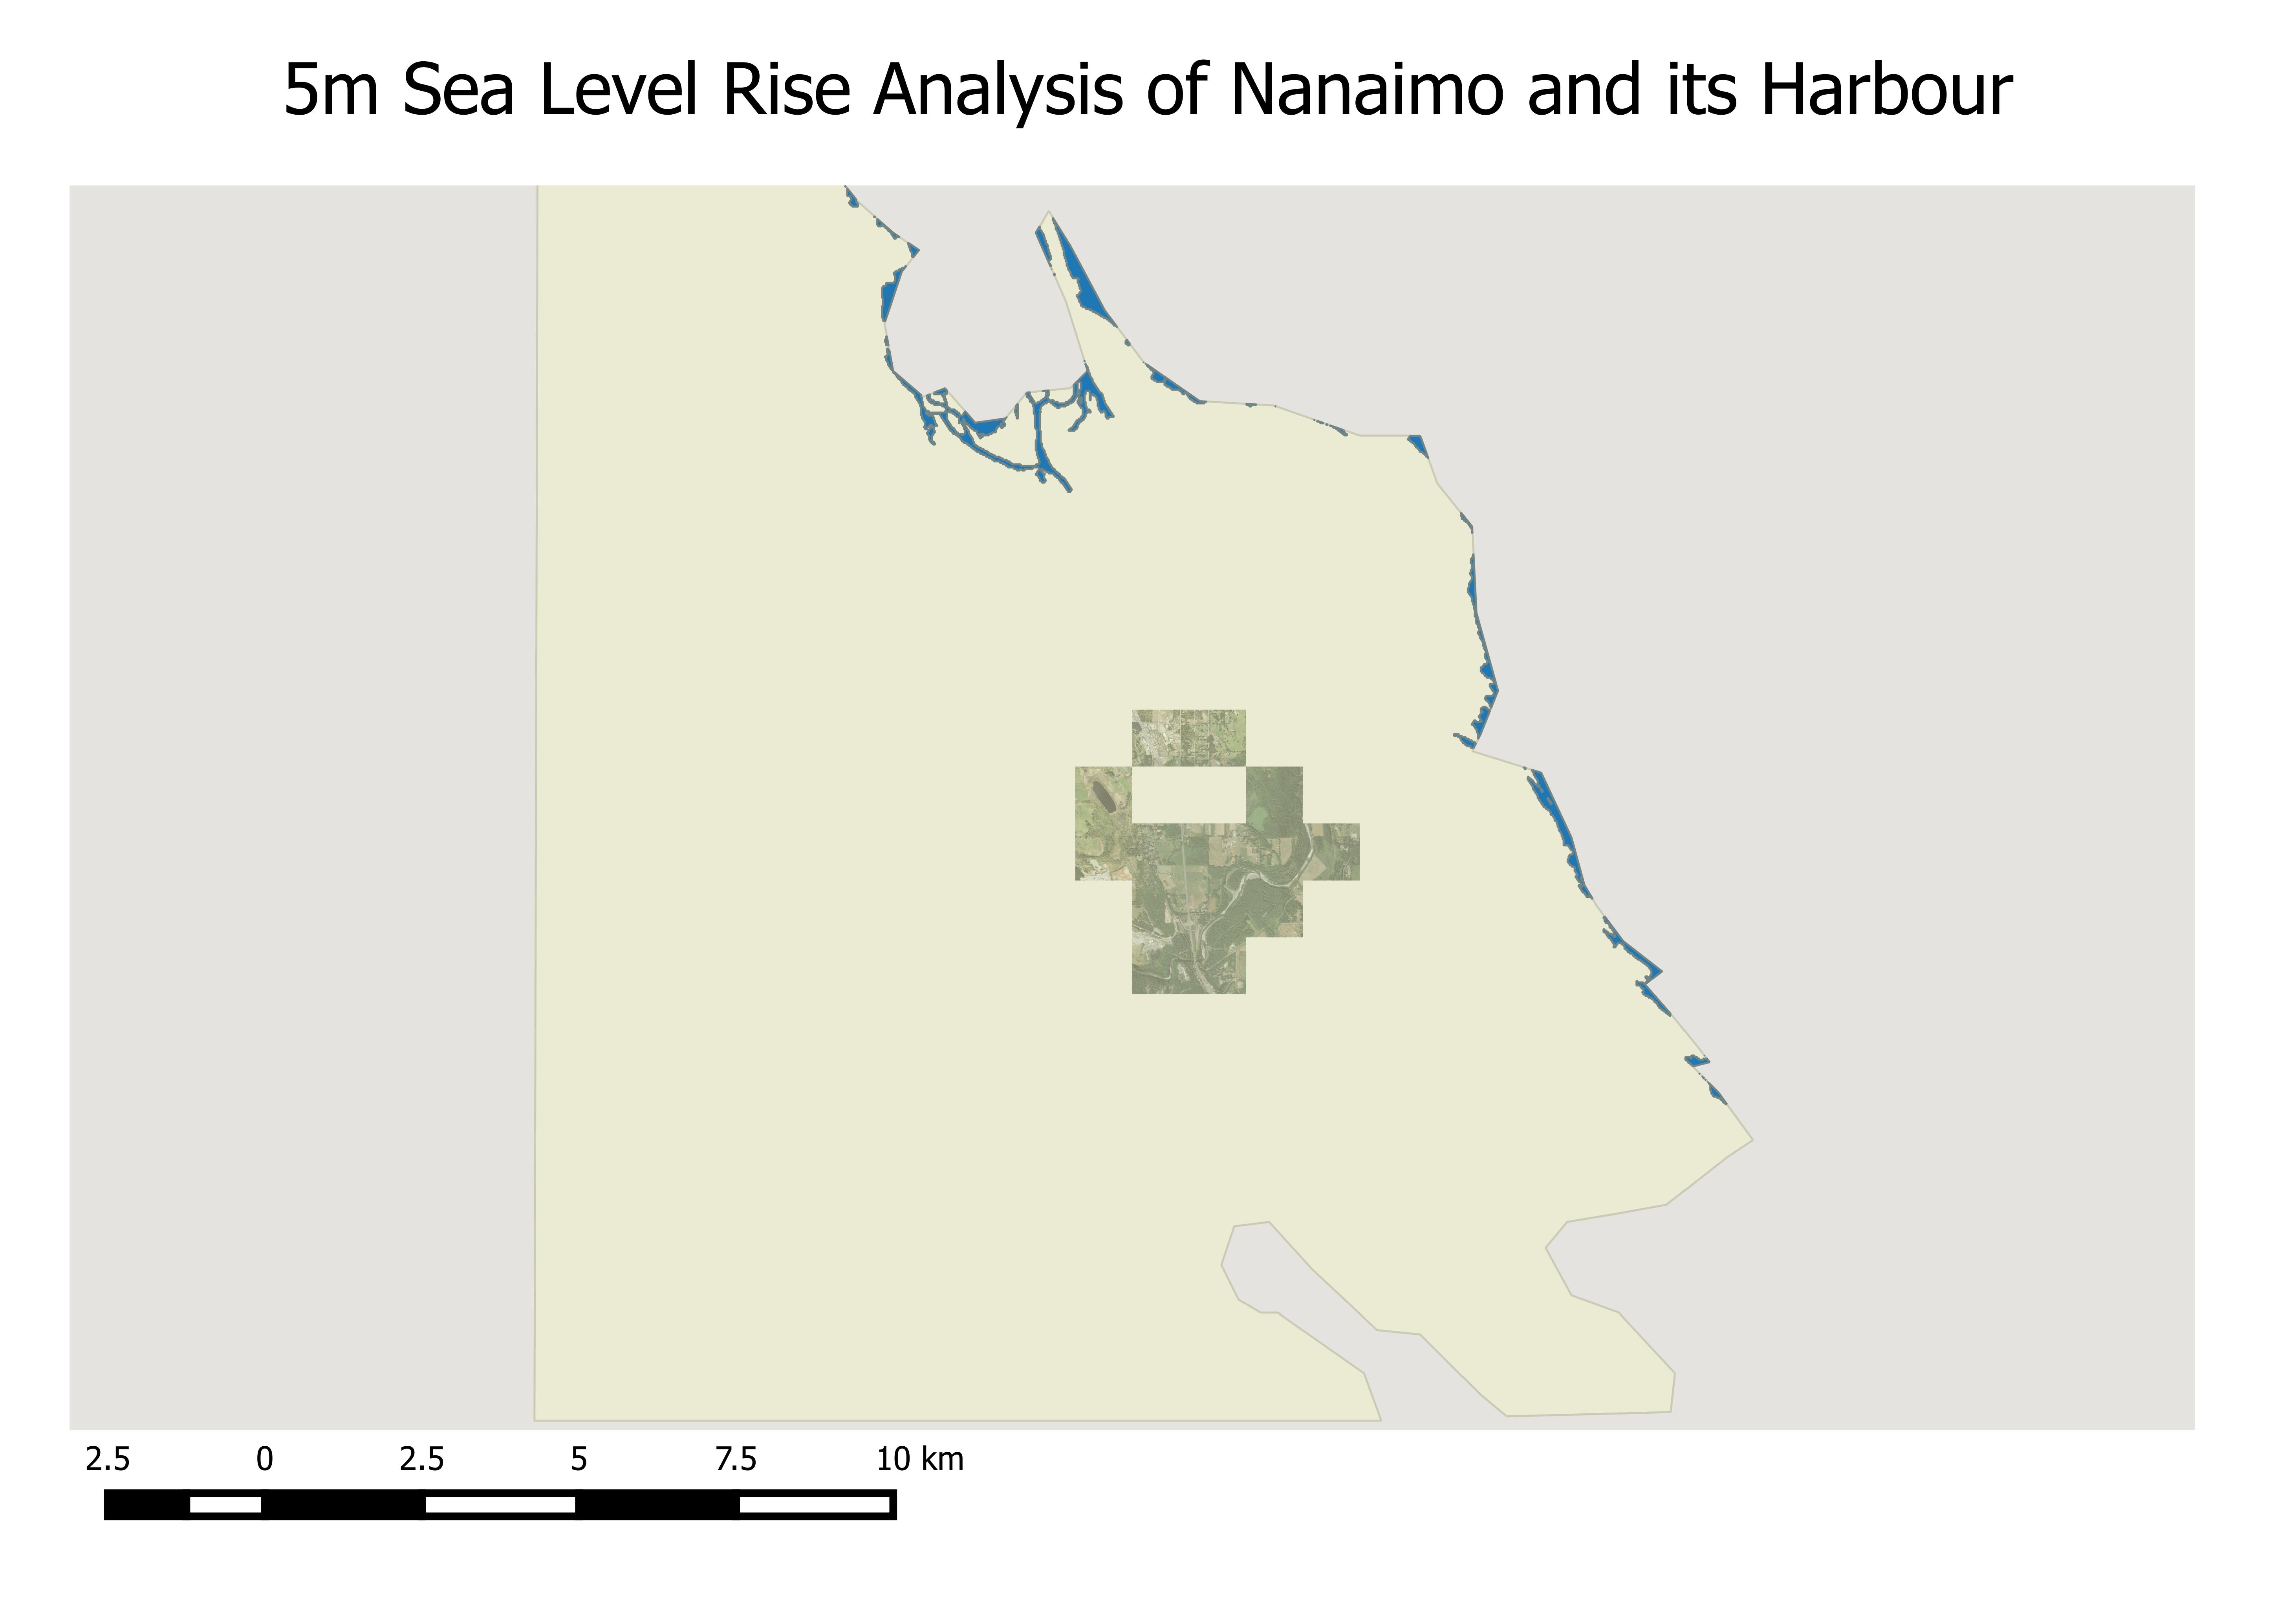
Use the vector intersect tool for both 3m and 10m polygon Sea DEM’s. The result creates polygons of sea inundation in Nanaimo based on a 3m and 10m sea level rise.
Examples below, correction(Label for 5m is actually 3m sea level rise result)
The next step is to determine the area of inundation. This is done by using the geometry tools to export geometry and create columns. This tool adds columns to the polygon shape files including area and perimeter in meters.
From here you can calculate the total area of sea inundation in the Nanaimo area for both 3m and 10m sea level rise indicators.

