Using InaSAFE to Create Real-World Natural Hazard Impact Scenarios
Contents
Objective
The objective of this project is to use InaSafe to create a realistic flood scenario for the Jakarta, and to create a natural hazard scenario of your liking.
Introduction
With the rise in temperature around the globe, sea levels and rain levels have risen a significant amount, a consequence of this is that natural hazards have been occurring more often and at a more predictable rate. In the past 5 years, Ottawa has seen two separate flood by the Ottawa river and two tornadoes one in the east and one in the west, respectively. It has become incredibly important to create a simulation that can give you a realistic idea of the damage that the city will take during one of these natural disasters. Planning potential displacements and food shortages in advance would greatly reduce the time for aid after a devastating event.
In this tutorial, we will be showcasing how to create a realistic flood scenario using InaSafe for the city of Jakarta
Intro to QGIS & InaSAFE
Quantum GIS 3.10 is a free Open Source Geographic Information System (GIS) program that is used to create, edit, visualize, analyze and publish geospatial information. The program is available for Windows, Mac, Linux, and BSD. This user-friendly Open Source GIS program is licensed under the GNU General Public License and is an official project of the Open Source Geospatial Foundation. [1]
QGIS has many different features including QGIS Desktop, where you can create, edit, visualize, analyze and publish geospatial information; QGIS Browser, where you can browse and preview your data and metadata as well as move around your stored data; QGIS Server, where you can publish your QGIS projects as OGC compatible WMS and WFS services; and QGIS Web Client, where you can publish your QGIS projects.[2]
InaSafe 5.01 or the most up to date version. InaSAFE is a free software that produces realistic natural hazard impact scenarios for better planning, preparedness, and response activities. It provides a simple but rigorous way to combine data from scientists, local governments, and communities to provide insights into the likely impacts of future disaster events. [3]
DISCLAIMER
InaSAFE has been jointly developed by the Indonesian Government-BNPB, the Australian Government, the World Bank-GFDRR and independent contributors. These agencies and the individual software developers of InaSAFE take no responsibility for the correctness of outputs from InaSAFE or decisions derived as a consequence.
Getting Started
Installing InaSafe Plugin
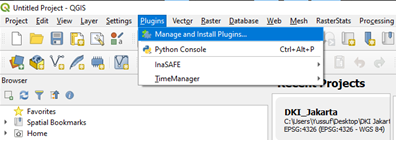
- Click "Plugins" a drop-down menu should show up
- Click "Manage and Install Plugins..." a menu should pop up
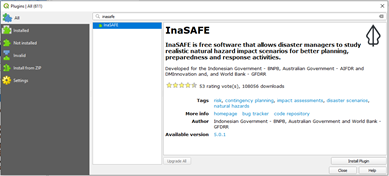
- Search for InaSAFE
- Click "Install Plugin" and wait for confirmation of install.
- Click "Close" to exit.
Getting the Data
Proceed to The InaSAFE website. Download the DKI Jakarta Zip and save it somewhere you can easily access it. This will allows us to use the tutorial data to run an example of how InaSAFE is supposed to perform.
Creating A Realistic Flood Map In Jakarta
Step 1 - Selecting the right Shapefiles to use
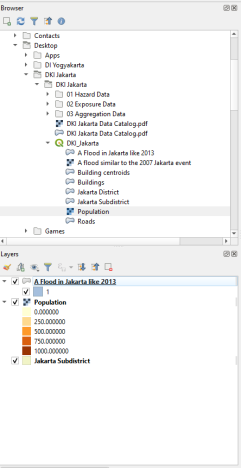
Ensure the following shapefile are inserted under your layers tab in QGIS, these shapefiles are available from the Jakarta zip you downloaded
Step 2 - Enabling the Shapefile for InaSafe use
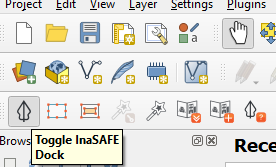
InaSafe requires a little data manipulation before any impact scenario can be simulated. To enable InaSafe ensure it is downloaded correctly and select to expand the InaSafe dock.
Step 3 - Using the Keyword Wizard to manipulate the shapefiles
Select the “A Flood in Jakarta like 2013”
Click on the “Keywords Creation Wizard”
With the Keywords Creation Wizard open.
1. Select Hazard
2. Select Flood
3. Select Single event
4. Select classified
5. Select the “FLOODPRONE” layer.
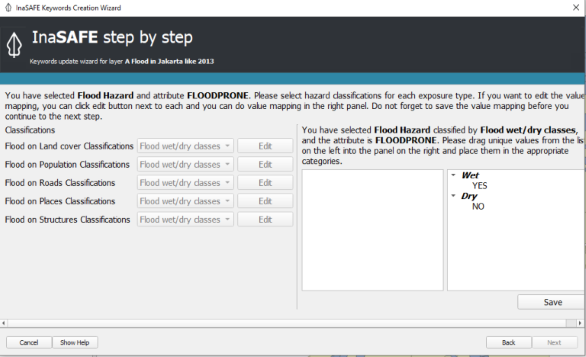
6. Change the classes from no classification to “flood wet/dry classes. Make sure on the right side that you select save for each time you change the classes
The rest of the options are optional, make sure you read through them to understand but you do not have to change anything all you need to do is select next until the keywords creation wizard closes.
Running Keywords wizard on population data
1. Make sure the population layer is selected
2. Select the “Keywords creation wizard”
3. Select exposure
4. Select the population
5. On the next page select Band 1
6. On the next page select Continuous
7. On the next page select count
The rest of the options are optional, make sure you read through them to understand but you do not have to change anything all you need to do is select next until the keywords creation wizard closes.
Selecting analysis area
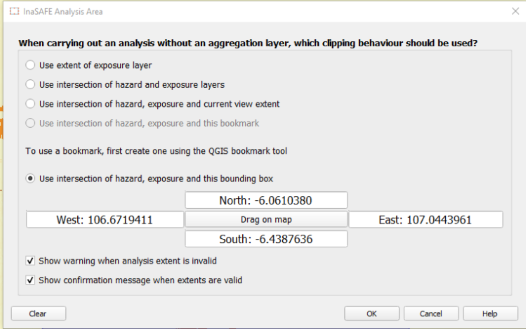
In the InaSafe toolbar select “set analysis area”, ensure that “Use intersection of hazard, exposure, and this bounding box”. Press on the Drag on map button that is in between all the coordinates. Select the area of interest that you would like the plugin to analyze (the whole city of Jakarta).
Running the analysis
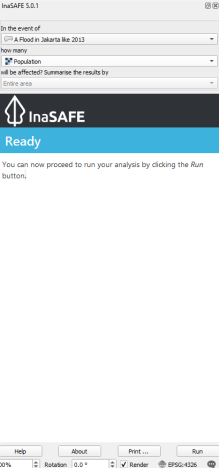
Once both of the shapefiles have run through the keywords creation wizard, make sure that the inaSafe dock is open and showing both of the shapefiles in the appropriate area. Under “In the event of” in the dock, there should be the “A flood in Jakarta like 2013” shapefile. Under the “how many” in the dock make sure the Population shapefile is the one selected.
Results
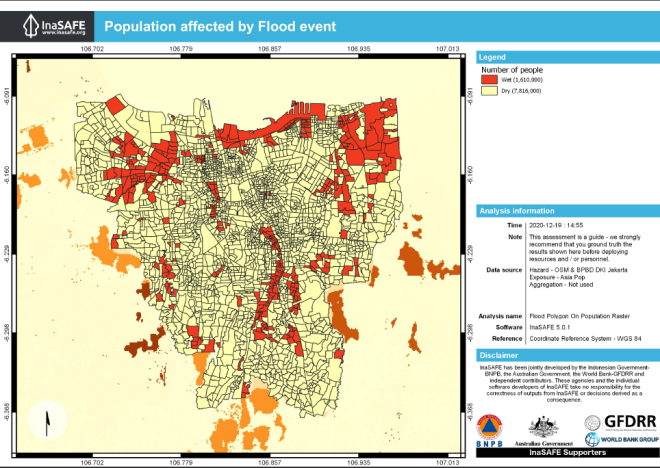
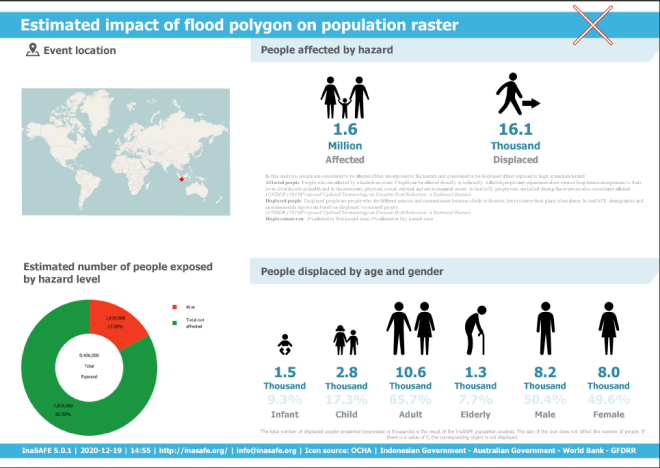
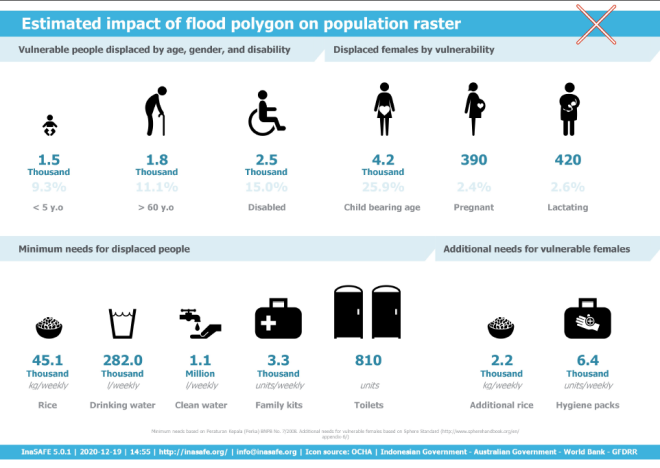
Press the run button on the bottom of the InaSafe dock, once the analysis has finished running select on the “print…” button and open the results as a PDF. The results should look similar to the results shown here.
Creating your own natural hazard Scenario
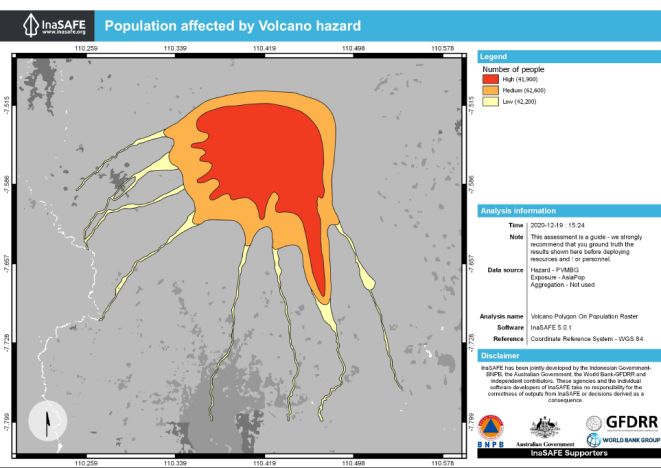
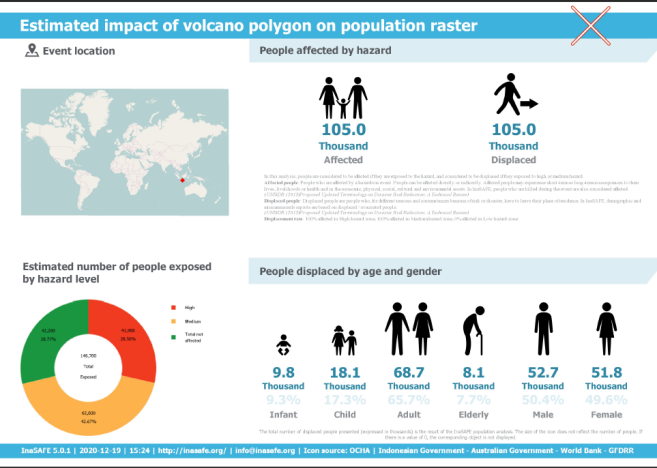
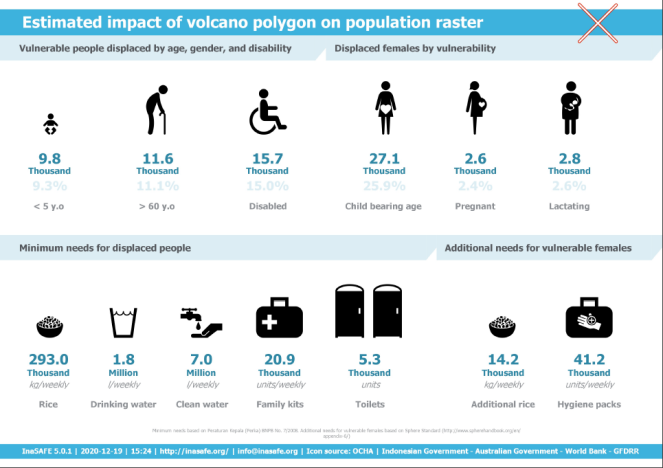
Download another file that is different from the Jakarta one, and run any type of natural Hazard scenario that you would want to try out. Here is an example of a Volcano analysis from Yogyakarta. Download your data from the InaSAFE website Remember you are limited to the data that is available from the website.
Resources
QGIS. (December 10, 2020). QGIS: A free and Open Source Geographic Information System. Retrieved December 10, 2020, from http://www.qgis.org/en/site/index.html
InaSAFE. (December 10, 2020). InaSAFE: A free Open Source Plug in. Retreived December 10, 2020, from http://inasafe.org/
