Difference between revisions of "Random Forest (ViGrA) Classification in SAGA"
| Line 13: | Line 13: | ||
==Software== |
==Software== |
||
The Random Forest classification can be run in a script |
The Random Forest classification can be run in a program as a script such as [http://www.r-project.org/ R] or [https://www.python.org/ Python]. However these programs can have a steep learning curve, and be complex with importing and exporting files. Luckily [http://www.saga-gis.org/en/index.html SAGA] version 2.1.2 contains a Random Forest Classification tool that uses . Note: Older version 2.0.8 does not contain the Random Forest Classification (ViGrA) tool. This tool comes from the producers of (VigrA) [http://ukoethe.github.io/vigra/ VigrA]. |
||
==Data== |
==Data== |
||
Revision as of 01:40, 21 December 2014
Tutorial on preforming Random Forest Classification using R
Contents
Purpose
This tutorial will demonstrate how to perform a Random Forest classification using the ViGrA tool found in SAGA. Random Forest (RF) is an algorithm that uses an ensemble of decision trees. Using multiple decision trees, the highest probability tree can be used to perform a classification or regression. This tutorial will cover the basics of creating training data, and running a land cover Random Forest classification in SAGA.
Introduction
Random Forest (RF) classification is an ensemble learning method, which uses decision tree classifiers. Where a random sub-sample of the data is taken and a classification is made from that sub-sample. This process is done to a user specified amount of runs and the average is taken to improve accuracy and prevent over-fitting. There is no better algorithm for classification, it runs efficiently on large data bases and even with large amount of variables (100+). It provides unbiased estimates and the tree provides a visual representation of which classes are important and which ones aren't. Also allows for easy computation of similarities and differences between variables and also statistical uncertainty for classification. Furthermore a basic Random Forest imagine classification is available in the open access software SAGA using the ViGrA.
Futher information on Random Forest can be found at wikipedia.org. Random Forest
Software
The Random Forest classification can be run in a program as a script such as R or Python. However these programs can have a steep learning curve, and be complex with importing and exporting files. Luckily SAGA version 2.1.2 contains a Random Forest Classification tool that uses . Note: Older version 2.0.8 does not contain the Random Forest Classification (ViGrA) tool. This tool comes from the producers of (VigrA) VigrA.
Data
The data that is needed to perform a supervised random forest classification is variables which are dependent on the users data. a classification can be done on a simple 4 band image and can iculded to many variables. Also there is a need for training data, where 70% - 75% of the training data should be used as classification and the other 30% - 25% should be used as validation data. The tools operation is done with the use of polygons, therefore if you have a training data set that is in a point file it needs to be converted into polygon, I recommended buffering your point file, to create a polygon) explained in tutorial how to perform this.
TUTORIAL for Classification
Uploading information into SAGA
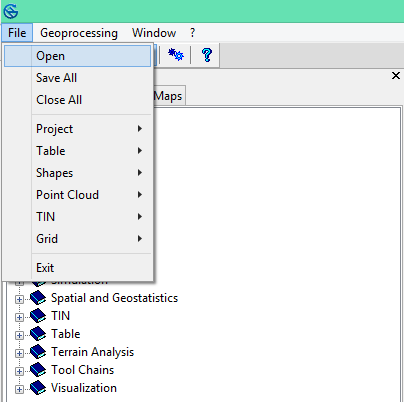
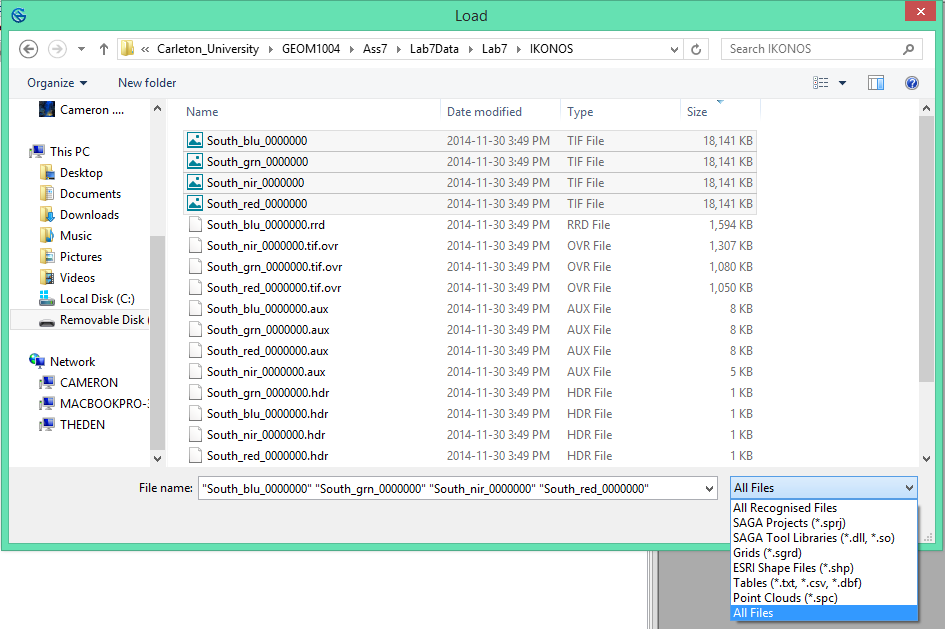
To upload files into SAGA, use your mouse and go to File->Open, from here a load screen will appear, click on the bottom right corner of the screen and select the all files tab, select your files and click open
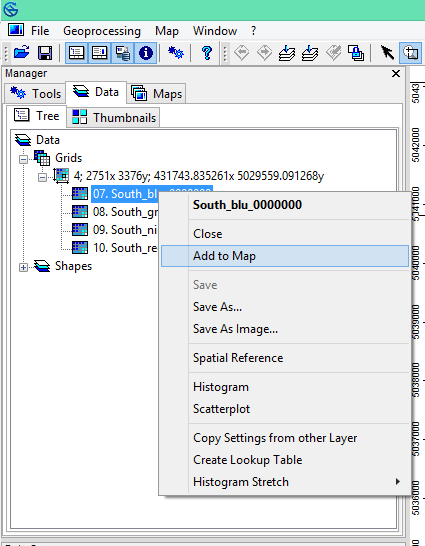
To visualize your data, select the data you would like to display and click on Add to Map
Creating Training Data(Points) for each class
To create training data, the over all data set has to contain a minimum of random 100 points. We will create 3 classes of point files for the classification(water, forest, and urban), the water class will be demonstrated below. (note that forest and urban classes are created in the same fashion).
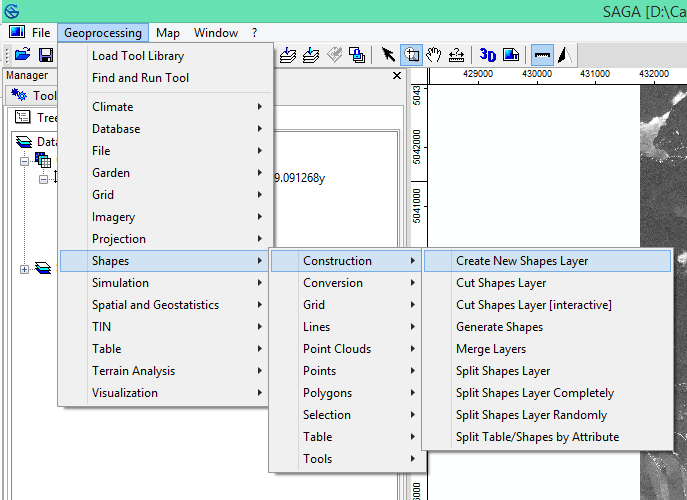
to create a point file, we start by creating a new layer file. Select geoprocessing->shapes->add new shape file
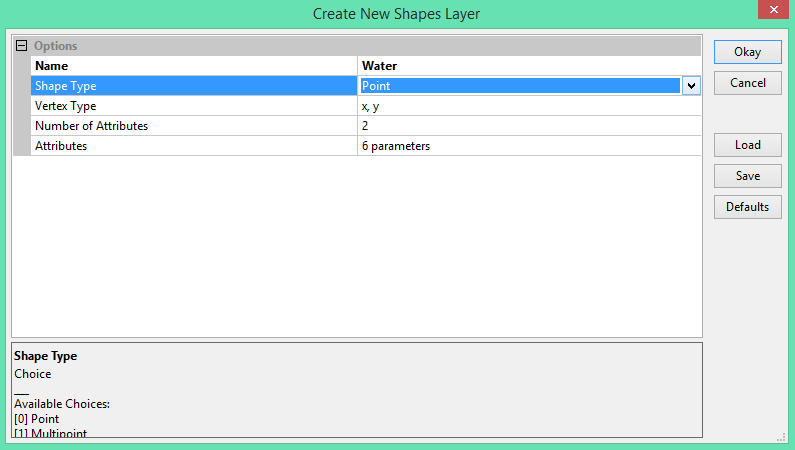
Name your class for points, and make sure the shape type is selected to be points
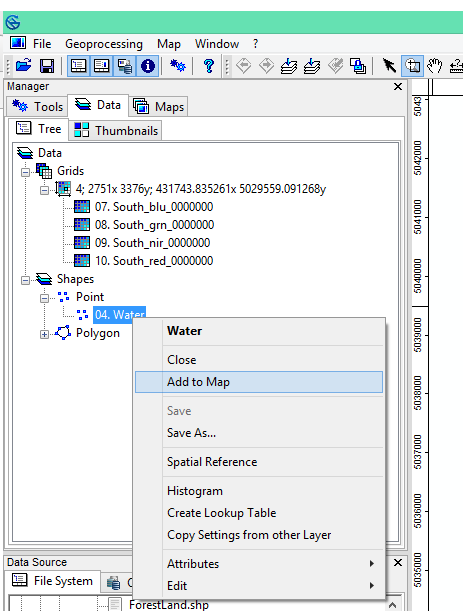
Now a point shape file has been created, however we must add the individual points still, to add a point right click on the created layer and add to map to ensure that the layer has been activated.
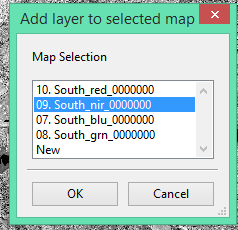
You will see a small screen, asking which map to upload the shape file to, as I will be creating a class for water I will select the image band that best represent this class, in my case NIR band.
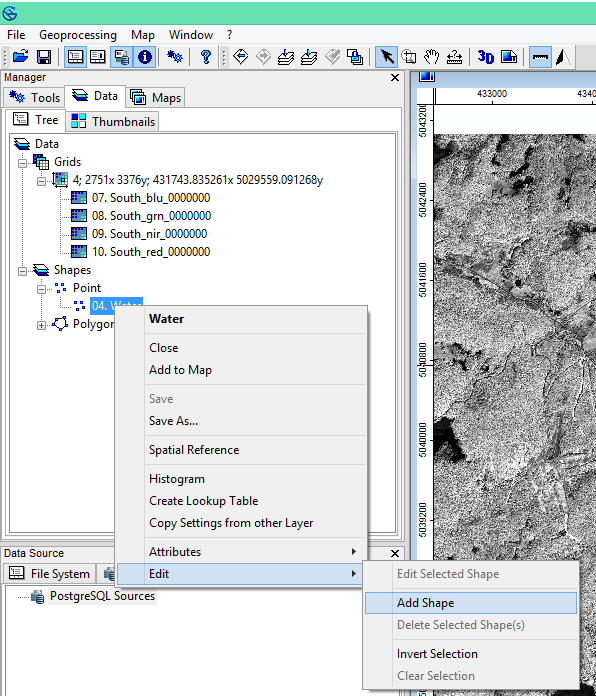
Too add a point, activate the add shape feature that is in the Edit-->Add Shape
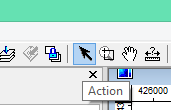
Now that the shape file add has been activated, we can create a point file by selecting the action tool in the bar
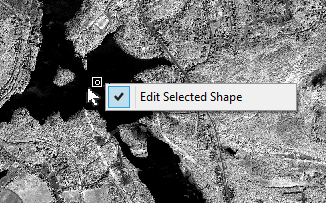
Then select the area in which you wish to create the point and click, a small square with a circle inside will form, that represents the location that you chose, to finalize the creation either press enter or double left click on the mouse and click on the only option to edit selected shapes.
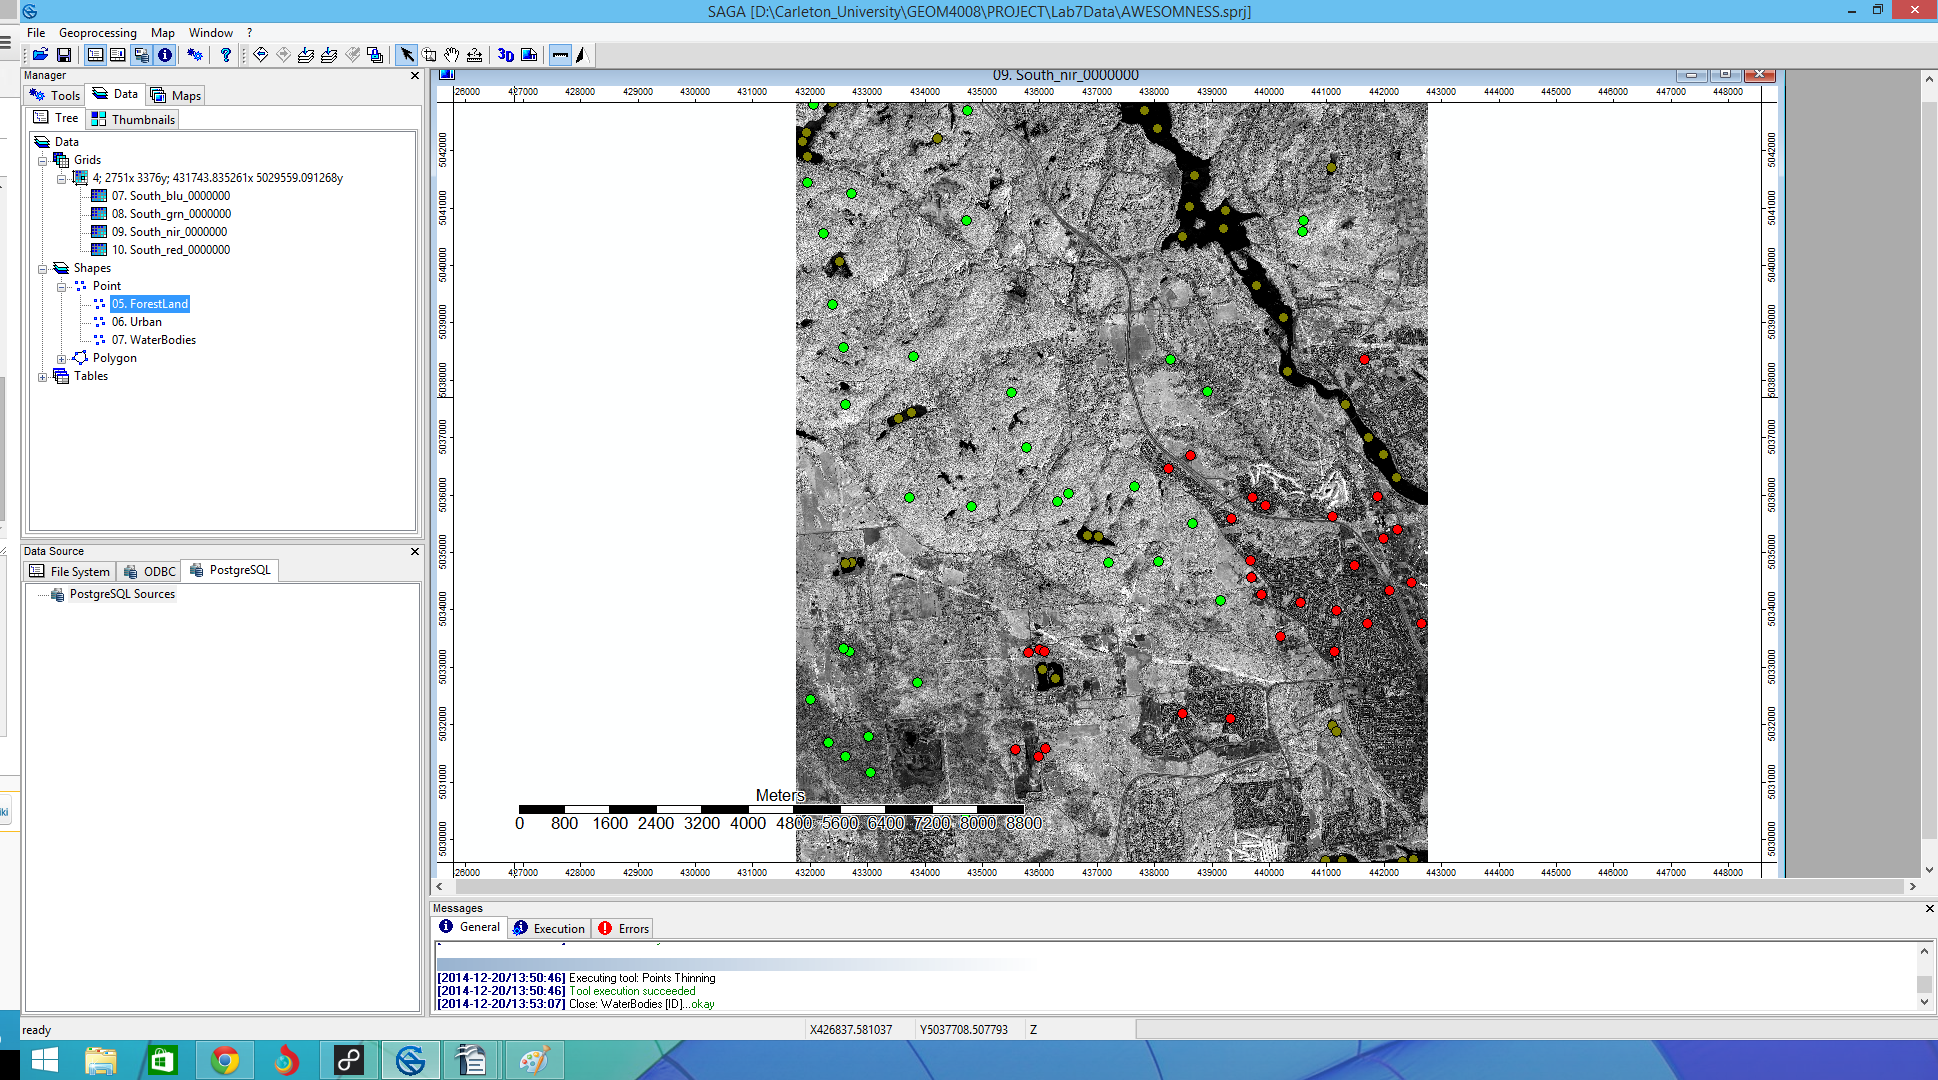
Repeat the add shape process for the water layer file to keep adding points to the layer. Add enough points that will allow you to properly sample the area. I would recommend a minimum of 30 points per class.
You should have a training data set now of points that resembles the following image.
Buffering and Merging layers
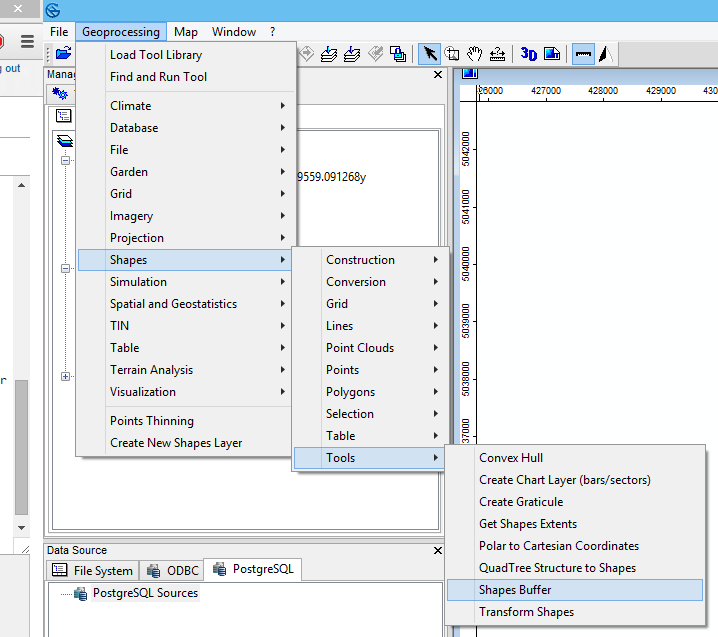
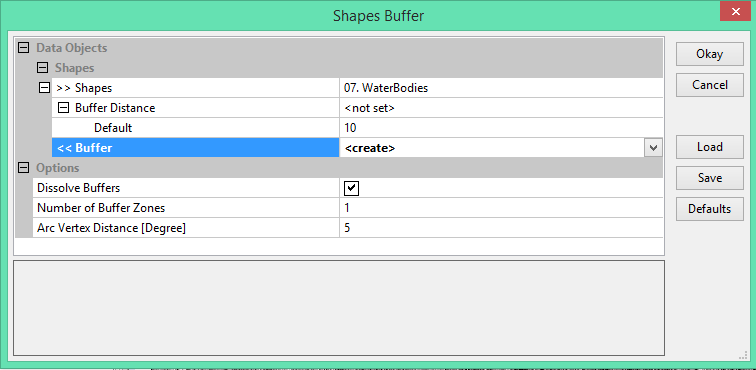
The points need to be converted into polygons which is achieved by buffering the points. Points have to be individually buffered before they are merged. To buffer a point file select shapes->tasks->Shapes buffer
In the menu that pops up, select the buffer distance to not set and then select a appropriate buffer size, I chose 10 for my classification, the higher detailed that your training data is in you can select a smaller size, or if the features are very similar you can choose a larger buffer size.
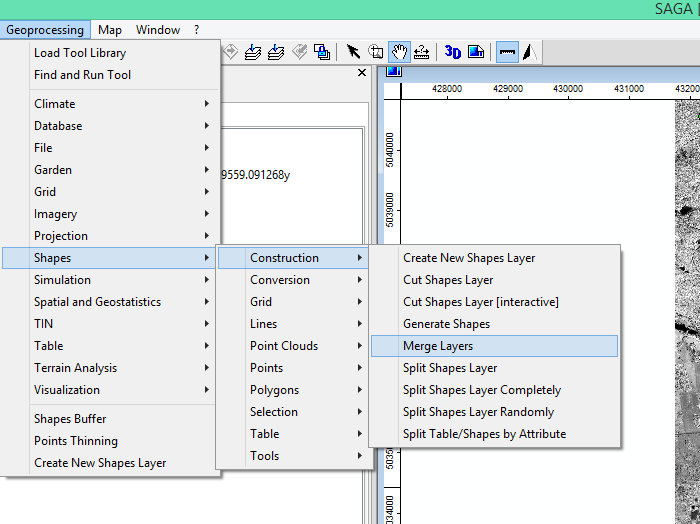
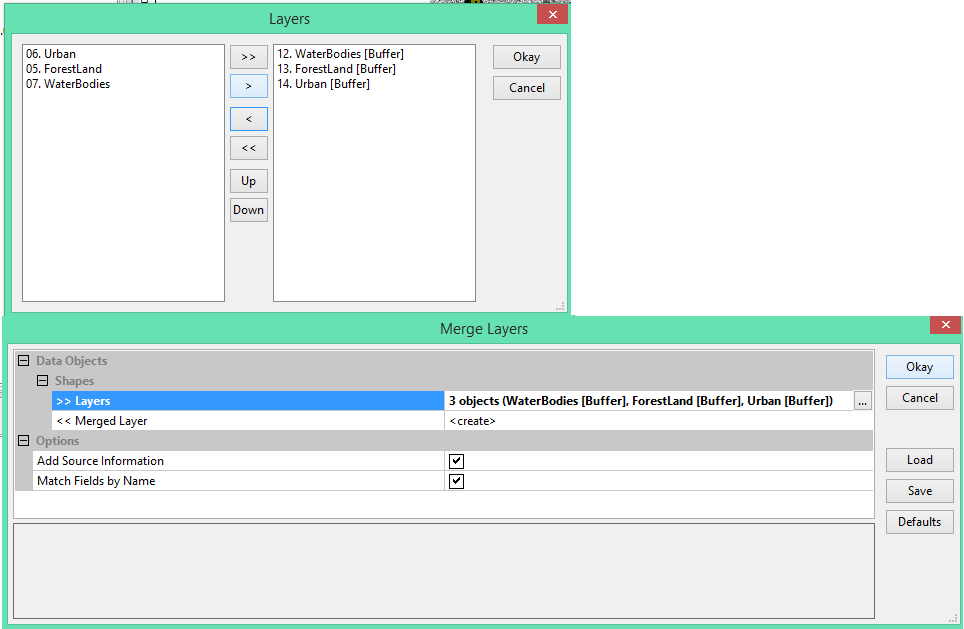
Once you have created the three buffer files, you can merge these polygons together to create a single data set of polygons for your classification training data. To merge layers select the Shapes->Construction->Merge Layers
Then you have to select the layers you wish to merge(making sure they are the buffer layers).
You will have your overall polygon training data set to be used in your classification. NOTE you should have a smaller cross validation data set created as well following the same steps however only using 25-30% of your total points.
Running the classification
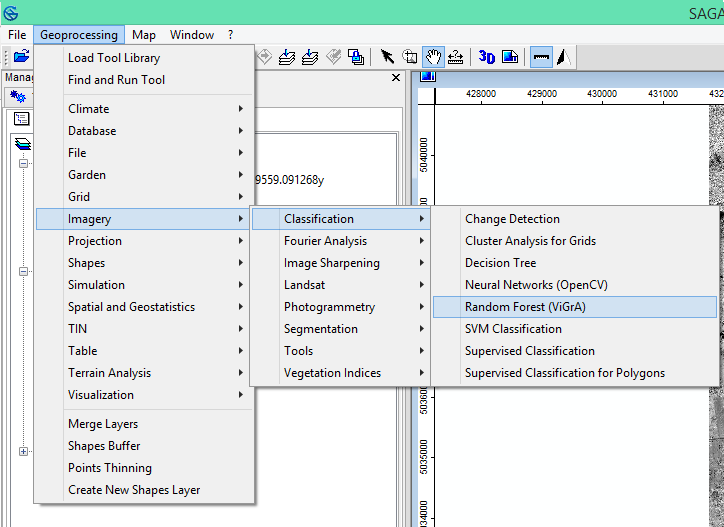
Open the imagery->Classification->Random Forest(ViGrA)
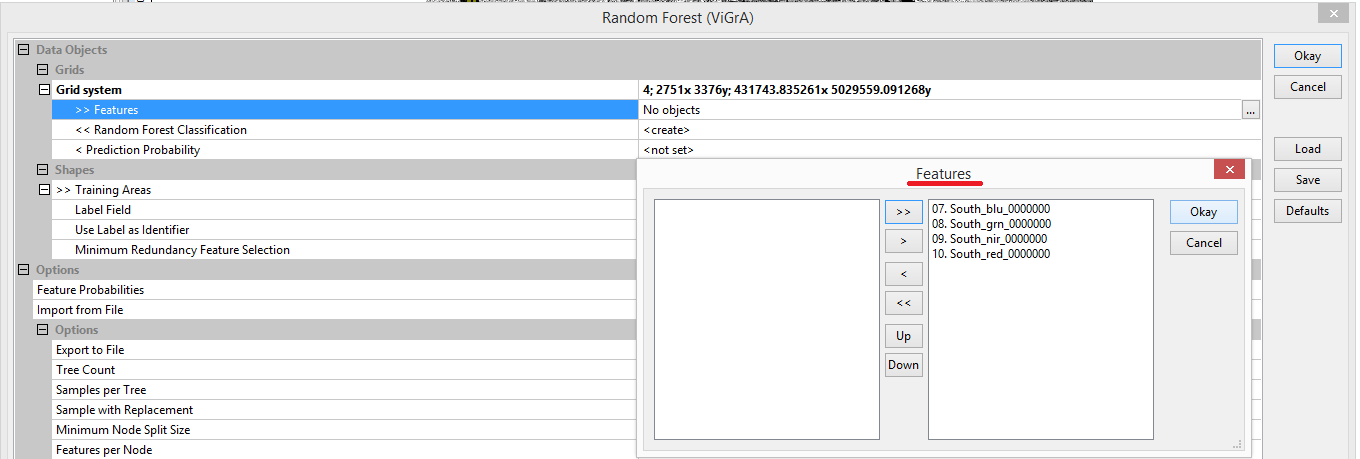
Then upload all the image bands you wish to load by selecting the Gridsystem you wish to use, and then the Features you wish to upload.
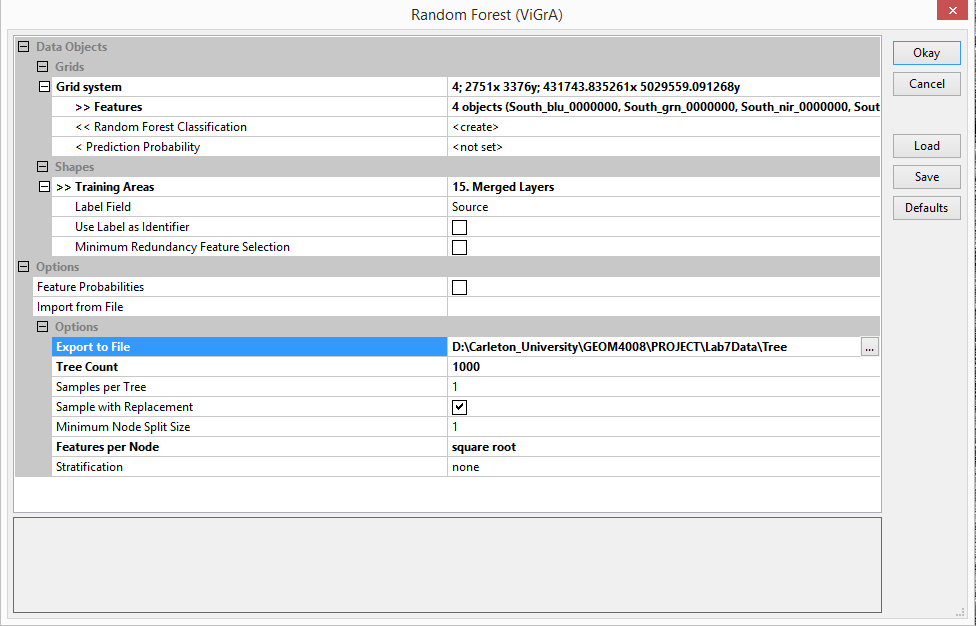
Select the number of trees you wish to create and other settings. (note that it took approximately 3 mins to run on a intel i7-4790K 4.00 quad core processor) Refrain from running larger trees then this unless you are allowing it to run overnight.
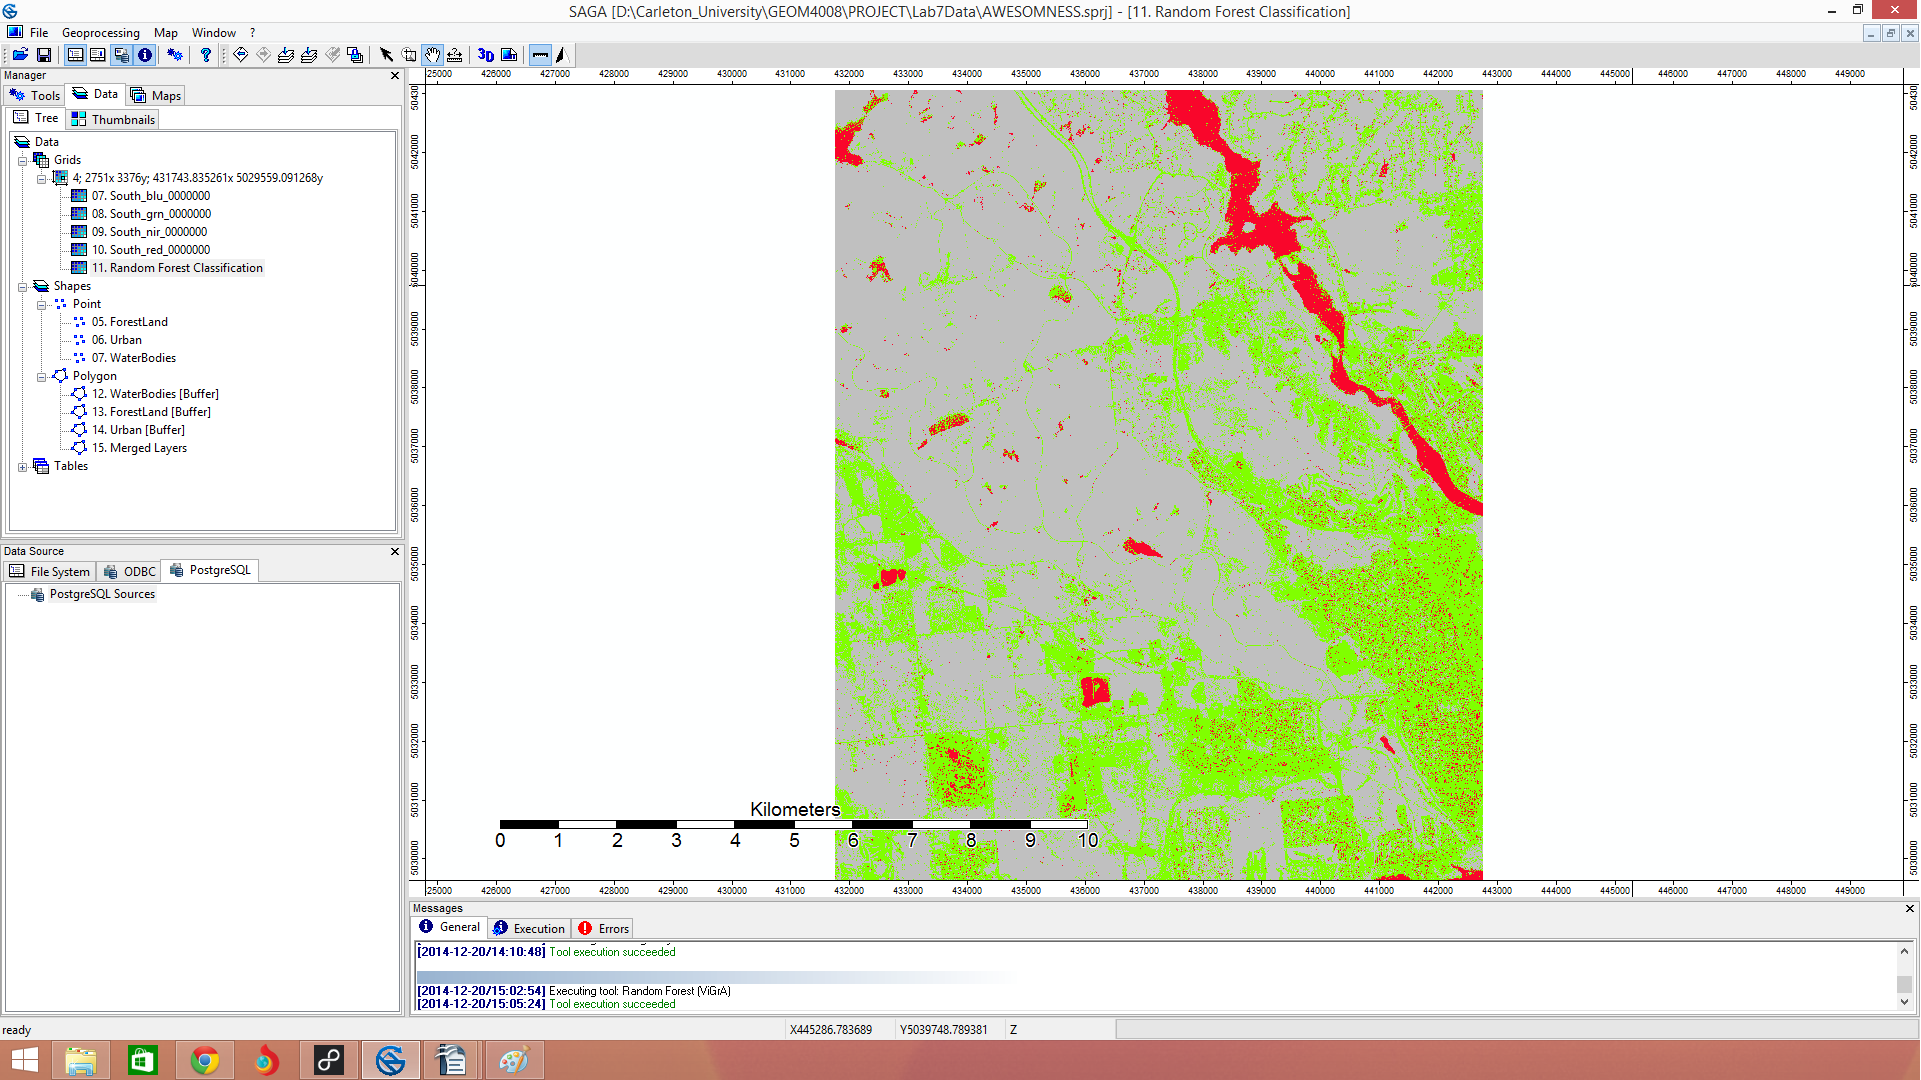
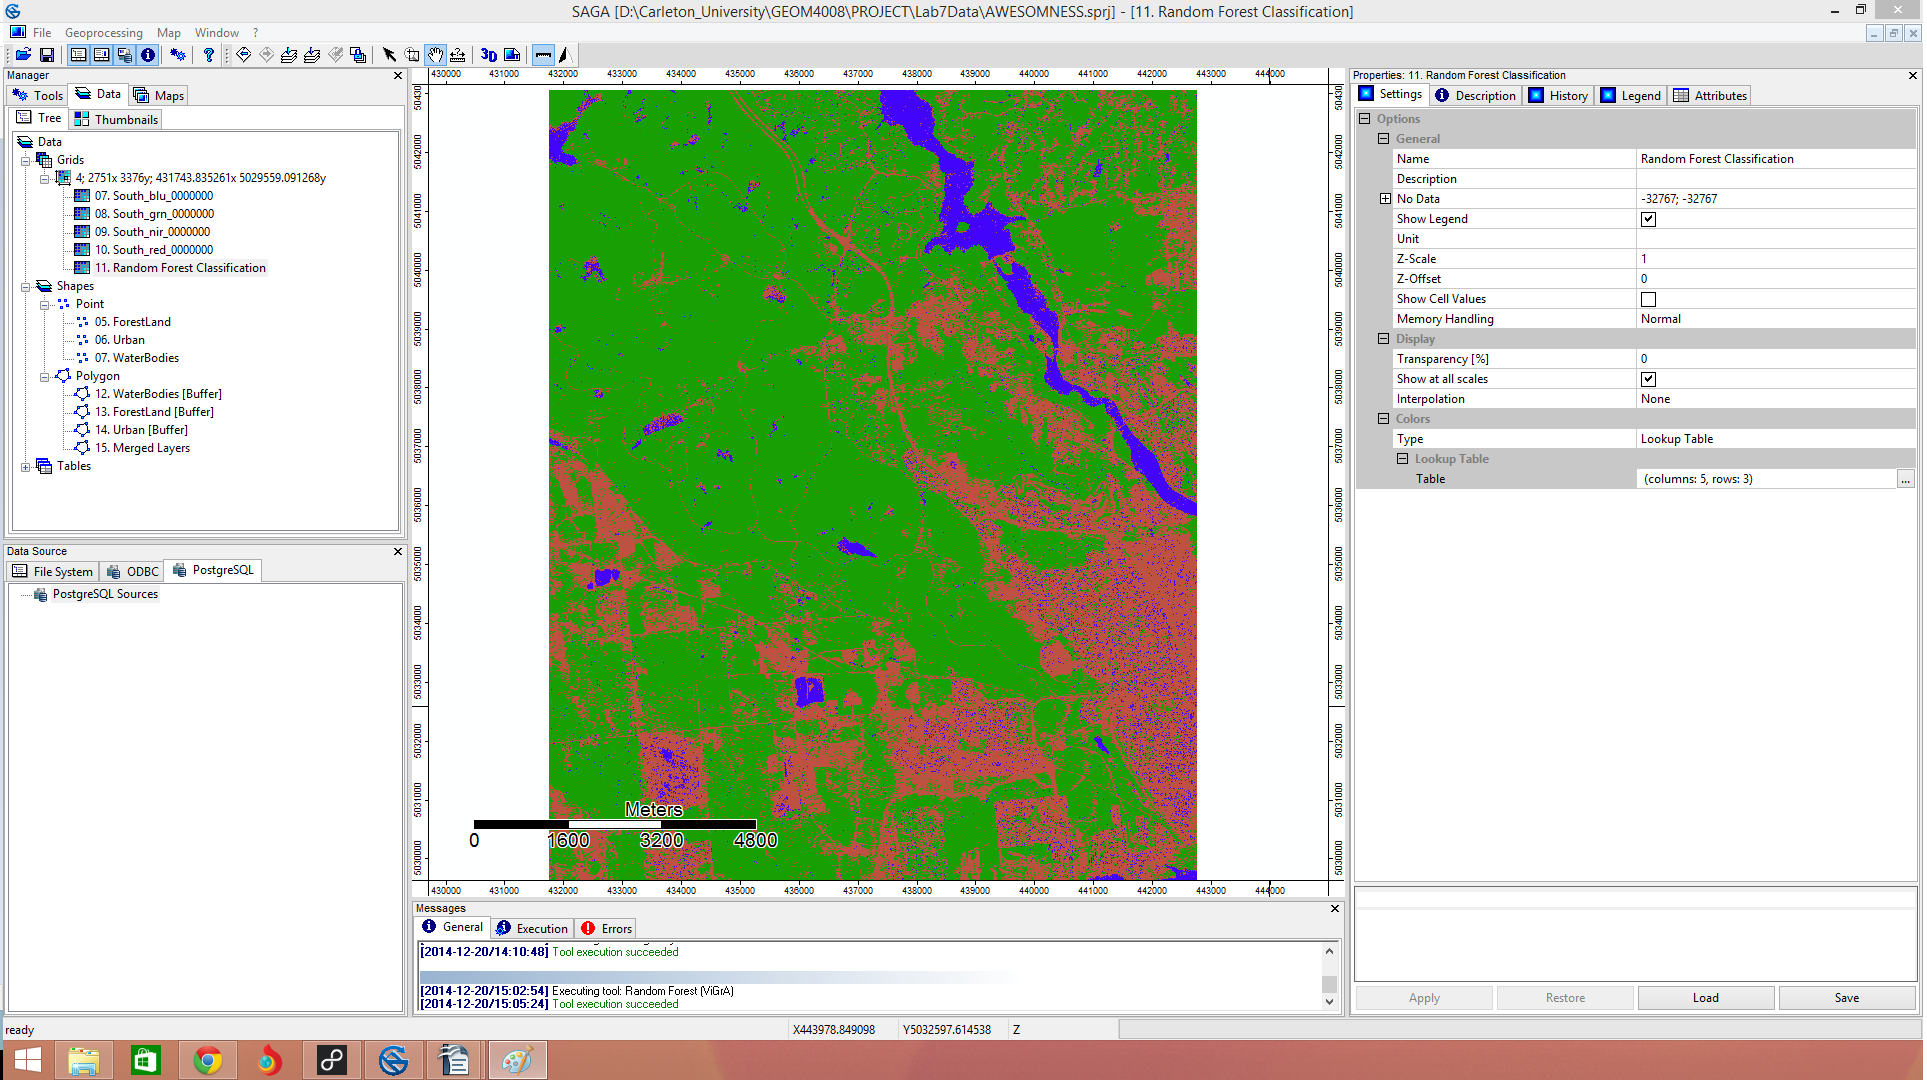
This is what the final image will look like
Tutorial for editing map collours
How to change the colours in a map for better visual representation.
Now that you have successfully performed a Random forest classification, the output map is colour displeasing.
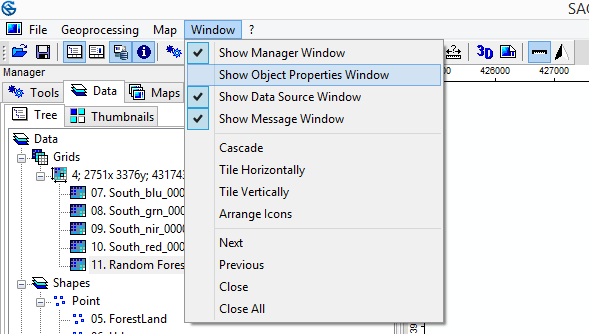
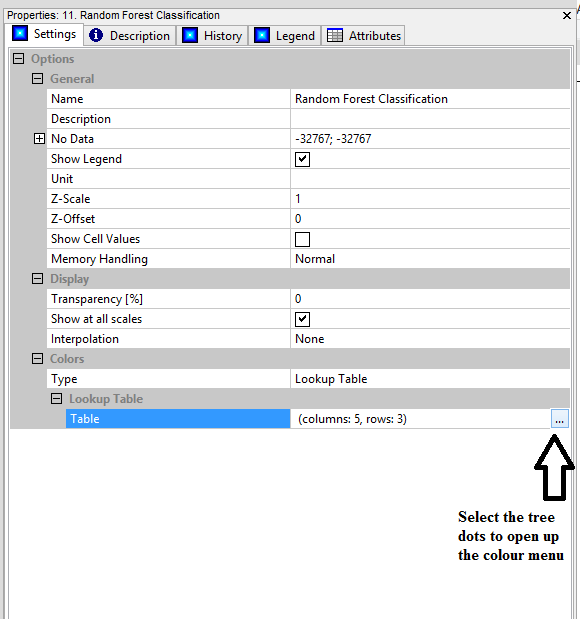
To change the properties of a map we must ensure that the properties tab is activated. to activate the properties tab click on the window tab and select the show properties
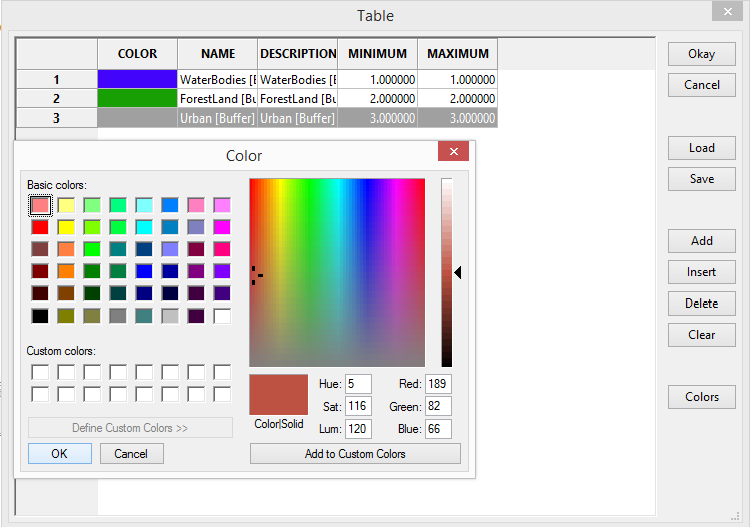
Then choose the lookup table options
From here change the colours into your desired format
Then you will have your final product
Conclusion
The tool performs relatively quick, and classifies the area well. Validation data needs to also be tested, as well as it would be nice it it also included importance plots as an additional export.
