Difference between revisions of "Creating Thematic Maps Using the Cartographic Composer in GRASS GIS"
| Line 2: | Line 2: | ||
The purpose of this tutorial is to introduce the Cartographic Composer in GRASS GIS and use the Cartographic Composer to create 2 thematic maps. The maps will then be recreated in QGIS to determine differences in the visual aspects of the final map products. |
The purpose of this tutorial is to introduce the Cartographic Composer in GRASS GIS and use the Cartographic Composer to create 2 thematic maps. The maps will then be recreated in QGIS to determine differences in the visual aspects of the final map products. |
||
The data used for this tutorial is open data, which is available from the City of Ottawa and Scholars GeoPortal. |
The data used for this tutorial is open data, which is available from the City of Ottawa and Scholars GeoPortal. |
||
| − | GRASS GIS version 7.8.4 |
+ | GRASS GIS version 7.8.4, and 3.14 "Pi" version of QGIS is used during the tutorial. |
Link to Open Ottawa data: https://open.ottawa.ca/ |
Link to Open Ottawa data: https://open.ottawa.ca/ |
||
Revision as of 21:10, 6 December 2020
Introduction
The purpose of this tutorial is to introduce the Cartographic Composer in GRASS GIS and use the Cartographic Composer to create 2 thematic maps. The maps will then be recreated in QGIS to determine differences in the visual aspects of the final map products. The data used for this tutorial is open data, which is available from the City of Ottawa and Scholars GeoPortal. GRASS GIS version 7.8.4, and 3.14 "Pi" version of QGIS is used during the tutorial.
Link to Open Ottawa data: https://open.ottawa.ca/
Link to Scholars GeoPortal: http://geo2.scholarsportal.info/
GRASS GIS and QGIS are both available for Windows, Linux and MacOS. This tutorial will be performed using a Windows machine.
Link to QGIS website, where you can download the program for all three operating systems: https://qgis.org/en/site/forusers/download.html
Link to GRASS GIS website, where you can download the program for all three operating systems: https://grass.osgeo.org/download/

Obtaining the Data
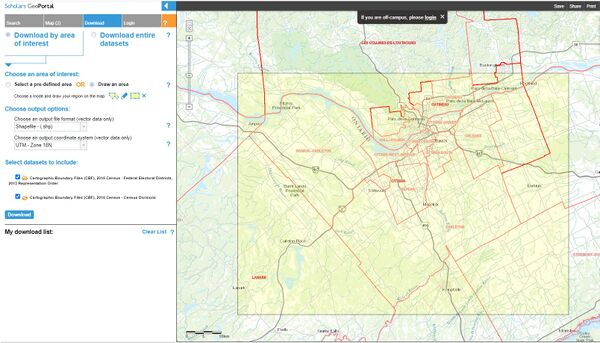
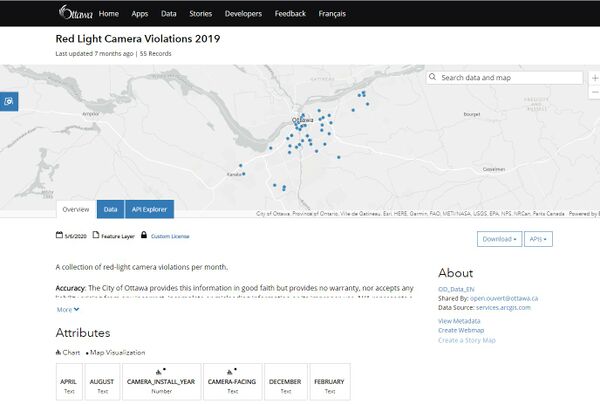
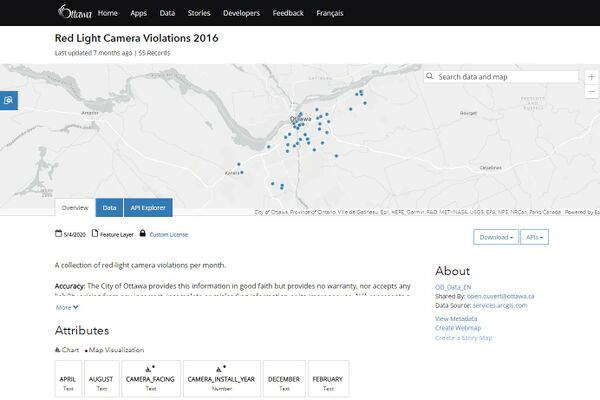
The data that will be used during this tutorial is a base layer of the City of Ottawa from Scholars GeoPortal and two datasets from Open Ottawa: Red Light Camera Violations 2016 and Red Light Camera Violations 2019. Any open data from the City of Ottawa can be used during this tutorial but this is the specific data that will be used for the purpose of the tutorial.
Base layer data of the City of Ottawa selected for the purpose of the tutorial.
Open data of 2019 red light camera violations downloaded for the purpose of the tutorial.
Open data of 2016 red light camera violations downloaded for the purpose of the tutorial.
Once all of the data of your choice has been downloaded, it is ready to be imported into GRASS GIS.


