Creating Thematic Maps Using the Cartographic Composer in GRASS GIS
Contents
Introduction
The purpose of this tutorial is to introduce basic operations in GRASS GIS and use the Cartographic Composer to create a thematic map demonstrating locations of red light camera violations in the City of Ottawa in 2016. The same map will then be created in QGIS to determine and compare differences in creating the visual aspects of the final map products. This tutorial is ideal for a beginner using the GRASS GIS Cartographic Composer, and also touches a bit on the functions of the GRASS GIS program in general. The data used for this tutorial are open data, available from the City of Ottawa and Scholars GeoPortal. GRASS GIS version 7.8.4 and 3.14 "Pi" version of QGIS are used during the tutorial.
Link to Open Ottawa data: https://open.ottawa.ca/
Link to Scholars GeoPortal: http://geo2.scholarsportal.info/
GRASS GIS and QGIS are both available for Windows, Linux and MacOS X. This tutorial will be performed using a Windows machine.
Link to QGIS website, where you can download the program for all three operating systems: https://qgis.org/en/site/forusers/download.html
Link to GRASS GIS website, where you can download the program for all three operating systems: https://grass.osgeo.org/download/
Obtaining the Data
The data that will be used during this tutorial is a base layer of the City of Ottawa from Scholars GeoPortal and two datasets from Open Ottawa: Red Light Camera Violations 2016 and Red Light Camera Violations 2019. Any open data from the City of Ottawa can be used during this tutorial but this is the specific data that will be used for the purpose of the tutorial.
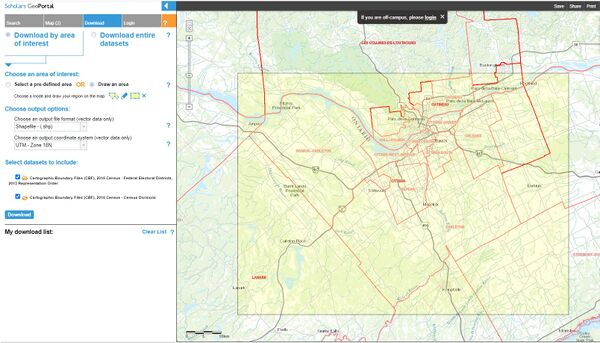
City of Ottawa Base Layer
Base layer data of the City of Ottawa selected for the purpose of the tutorial.
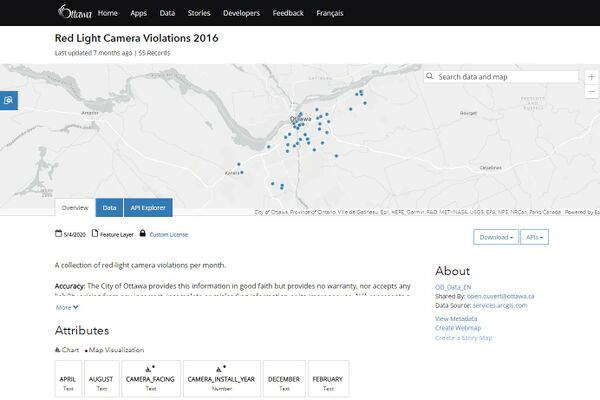
City of Ottawa (Open Ottawa) Red Light Camera Violations in 2016
Open data of 2016 red light camera violations downloaded for the purpose of the tutorial.
Once all of the data of your choice has been downloaded, it is ready to be imported into GRASS GIS.
Importing the Vector Data into GRASS GIS
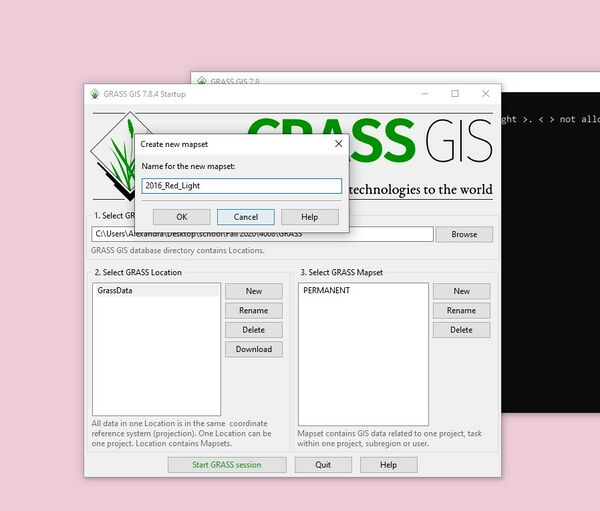
The first step is importing the data into GRASS GIS. Start the program and select the GRASS location desired, and create a new GRASS Mapset. I have created a new mapset in GRASS called 2016 Red Light, which will be the mapset for the 2016 red light violations. The GRASS "Location" button is the location of the data on your computer. The "Mapset" button is where map data is located.
Creating a new mapset in GRASS. When creating a name for the mapset, only ASCII characters can be used. When finished, select Start GRASS session.
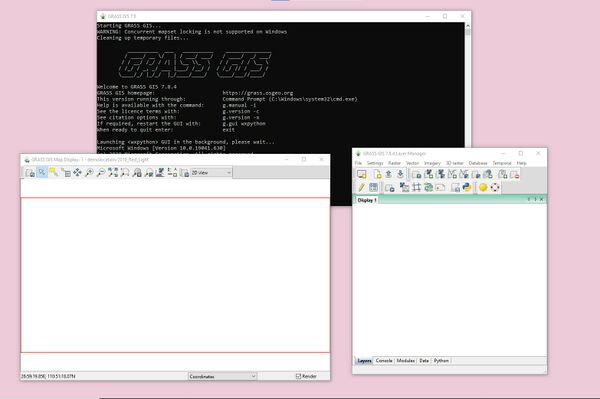
Main screen of GRASS in Windows.
Two files came with the Ottawa boundary shapefile that was downloaded for the City of Ottawa. The first one contains Census Divisions, and the other contains Federal Electoral Districts. Federal Electoral Districts are subdivisions in the City of Ottawa. Including these in the map will allow the user to determine in which subdivision the most red light violations occurred.
Next, import all three of the vector layers into GRASS GIS, under File>Import vector data>Simplified vector import with reprojection [v.import].
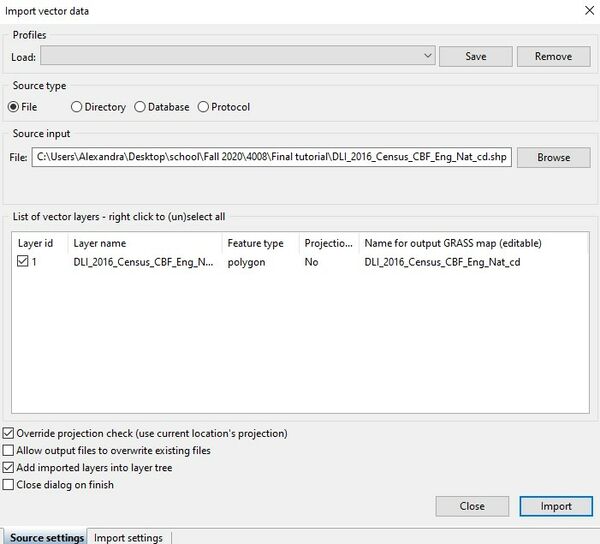
Importing Census Divisions shapefile into GRASS. Make sure to check "Override projection check (use current location's projection)". Click import once the correct file has been selected. Repeat this for the other two files, the Federal Electoral Districts shapefile and the 2016 red light data (or whatever data you have chosen to present on the map).
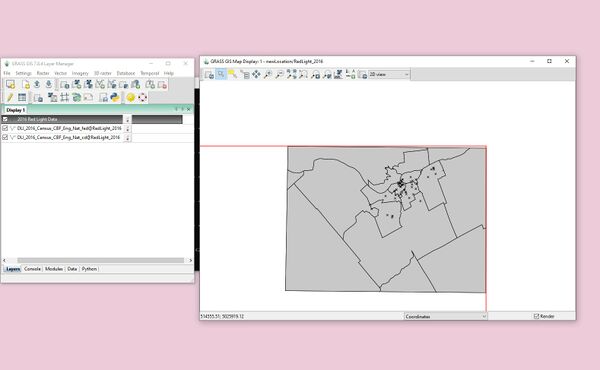
After importing all of the shapefiles, the map display in GRASS should display the City of Ottawa and all of the red light camera violations in 2016. The map demonstrates that the majority of red light camera violations are in Nepean, Downtown Ottawa and East Ottawa.
This is how the map should look in the Map Display in GRASS. Don't worry about the layout, the next section explains how to change the symbology of the red light camera violations and the colour/display of the map.
Editing the Map Layout in GRASS GIS
As seen in the Map Display, the map colour and the symbology of the map needs to be altered. The next step is to add labels to the subdivisions in the City of Ottawa. To check the attribute data of vector datasets in GRASS, highlight a vector file and click the Attribute Table Manager button on the task manager bar in GRASS.
Attribute Manager
Attribute manager button in GRASS GIS (highlighted in blue).
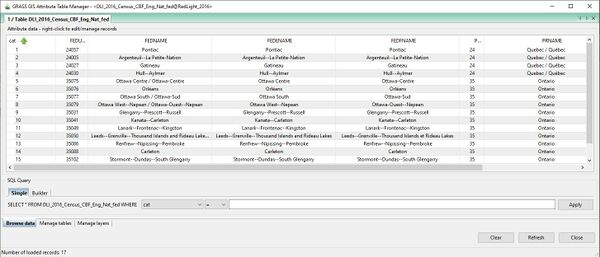
Upon clicking the attribute manager button, a new window will open.
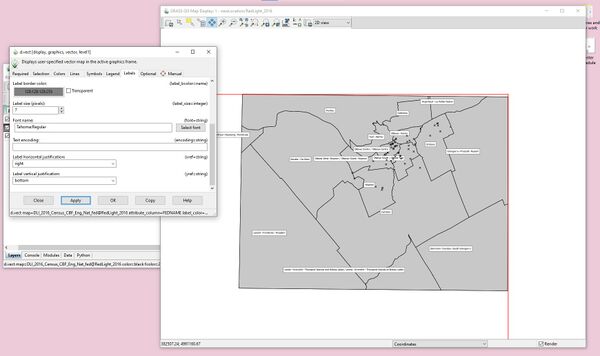
The attribute manager shows the data of the vector file. Looking at the attribute data, I am going to use the attribute "FEDNAME" to label the City of Ottawa because it clearly demonstrates the subdivisions within the city. To do so, right click the Federal Electoral Districts layer and click Properties. Navigate to Labels (d.vect) where you can label the map by the attribute "FEDNAME". In the Labels tab, you can also adjust the label colour, label background colour, label border colour, font size, label placement and the font name. For simplicity, I selected the Tahoma Regular font in a size 7 with a white background.
Map with the label tab in the Properties window of the Federal Electoral Districts layer (d.vect)
Symbology in GRASS GIS
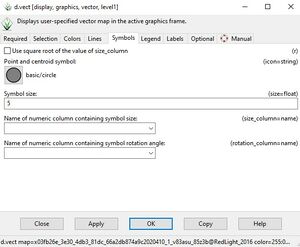
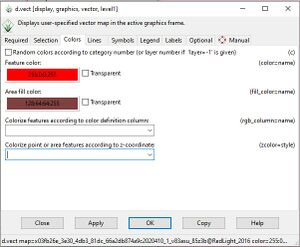
The next step is to edit the appearance of the symbology. To edit the symbology, right click the 2016 red light camera violation layer and navigate to Settings in the drop down toolbar (d.vect). For the purpose of the tutorial, I am going to create red circles for the red light cameras in Ottawa and label the total violations next to each point. First, change the symbol from an X to a circle and change the colour to red.
(d.vect) window, where the Symbology of the map can be edited. This photo demonstrates how to change the symbol on the map.
(d.vect) window, where the colour of the symbol can be changed.
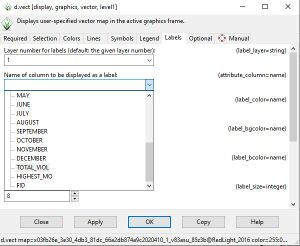
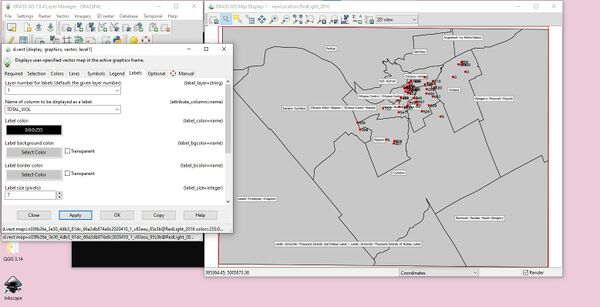
(d.vect) window, where I am adding a label on the 2016 red light camera violation vector layer, using the column TOTAL_VIOL (Total Violations) to label the amount of red light camera violations on each point
The map so far after adding labels and changing symbology of the red light camera layer, using (d.vect). The map clearly states the locations of red light cameras in Ottawa, and the total violations for each one in 2016.
During the creation of the map in GRASS GIS, make sure to save often to make sure the work so far will not be lost. The save button is in the toolbar and can also be accessed using Ctrl+S.
Using the Cartographic Composer in GRASS GIS
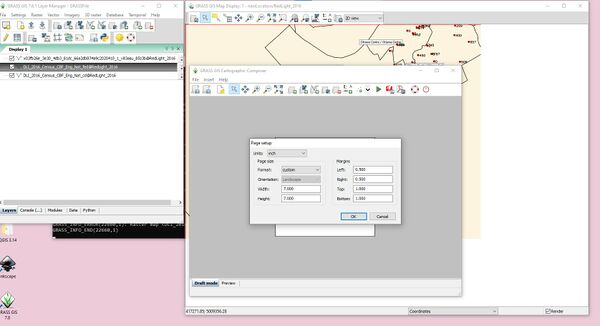
Now that the tools in the Map Composer have been explored a bit, it is time to start using the Cartographic Composer in GRASS to produce a final map product. The first step is navigating to File>Cartographic Composer [g.gui.psmap]. The default page size will be A4 so adjust the page size by going to File>Page Setup (Ctrl+P).
Map Frame
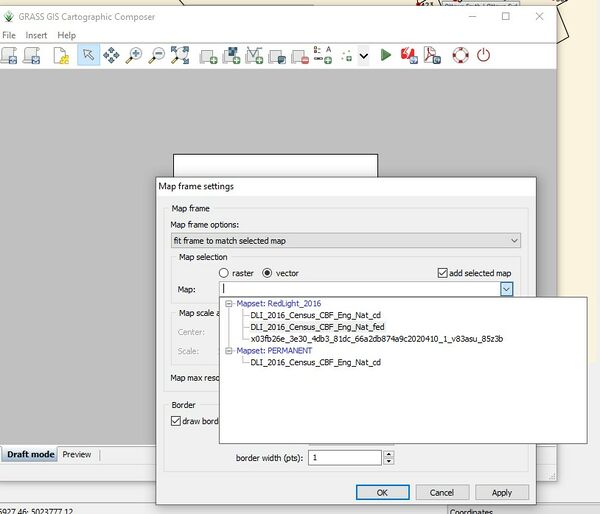
Next, in order to import the vector layers into the Cartographic Composer, a map frame needs to be selected. The map frame tool is located on the Cartographic Composer. Once the tool is selected, drag it on the page. The vector layers I have selected for the purpose of the tutorial are in a square shape, so I have created a map layer in the shape of a square. Once a map frame has been selected, a window called Map frame settings will pop up.
An overview of the map frame settings:
Map frame options: select fit frame to match selected map. This setting fits the map frame created to the raster or vector layer chosen in the map dropdown.
Map selection: either raster or vector can be selected. For the purpose of the tutorial, I selected vector because I am working with vector data. If you are working with raster data and looking to get the map frame to match the raster map, select raster. DEM maps would be added into the map frame as a raster. The drop down allows the user to select which layer they want to be displayed in the map frame. I chose DLI_2016_Census_CBF_Eng_Nat_fed, the vector layer with the Federal Census Districts of the City of Ottawa.
Map scale and center: This setting is available if "fixed scale and map center" is selected in the map frame options drop down. It allows the user to manually set their own scale and center.
Map max resolution: Measured by dots per inch. 300 is standard.
Border: This setting allows the user to draw a border around the map frame. The colour of the border and the width of the border can be changed. There is also a check box where the user can uncheck if they prefer to not have a border around their map frame.
Map frame settings in GRASS.
Click the Apply button once all of the desired settings have been selected.
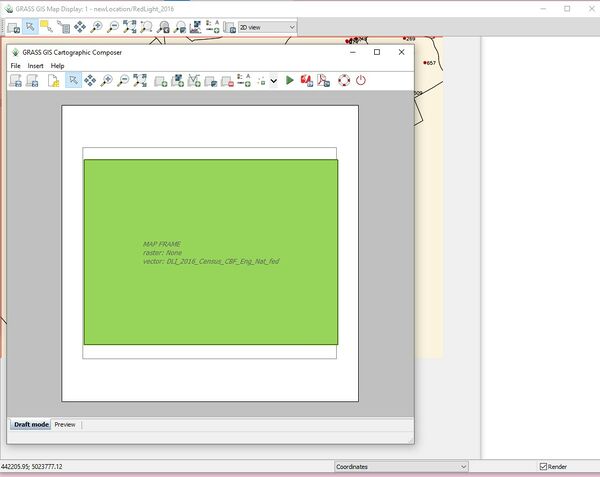
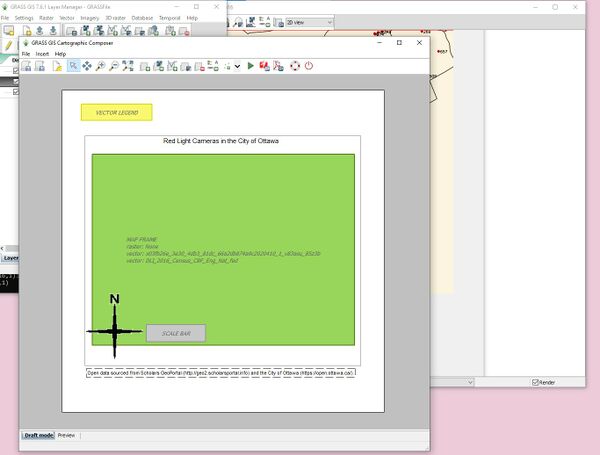
This is how the map frame will look in the cartographic composer once the map frame has been established. Unlike QGIS and other GIS applications, the cartographic aspects of the map are not visible until the map is exported to PDF, exported to another GIS software, or seen through a preview inside of the Cartographic Composer.
Vector Map Settings
The next step is to add the red light camera layer. In the toolbar, select the vector map settings icon or navigate to Insert>Vector map (Ctrl+V). To add the vector layer to the map, click on the drop down toolbar to select the red light camera layer, or whatever data layer chosen. Click Add to add the layer to the map frame.
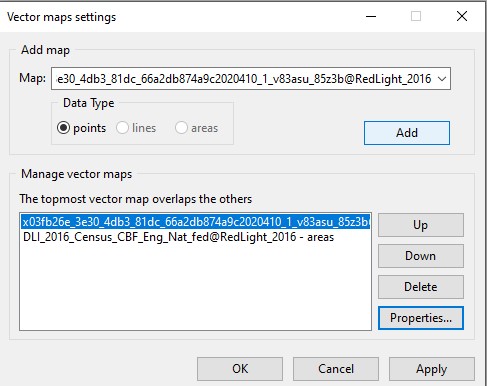
The layer will then navigate down to the section titled "Manage vector maps". The topmost layers will overlap the other layers. Considering the red light camera layer needs to be displayed as points on top of the Federal Electoral Districts layer, leave the red light camera layer on top as seen in the figure below. If you need to navigate the layers for whatever reason, selected the desired layer and click the Up or Down buttons. Click Apply to add the layer to the map frame.
The vector map settings window in GRASS.
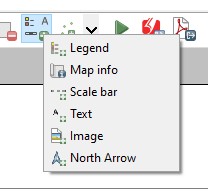
The next step is to add cartographic aspects to the map, such as legend, scale bar, a north arrow and some text (title and citation). All of these tools are located under the box in the toolbar as seen below.
Vector Legend
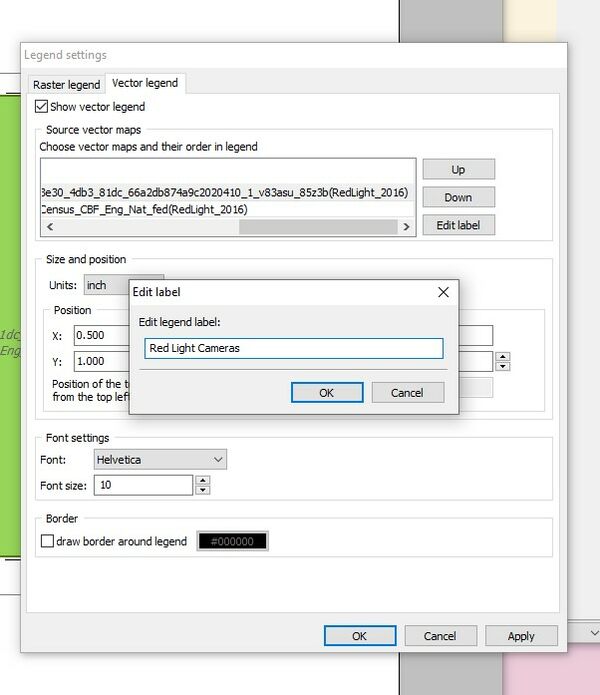
There are not many options in terms of cartography in GRASS GIS. Once a legend has been added to the map frame, double-click to open the settings window. Under the vector legend section, here are the tools:
Show vector legend: Box that can be checked if a vector legend is desired in the final map product. In the case of this tutorial, I have checked it.
Source vector maps: Here the order of the vector maps in the legend can be changed using the Up and Down buttons. The labels cannot be edited in the map frame window, so to edit the way they appear on the legend, select Edit Label. I have edited the label names to "City of Ottawa" for the Federal Electoral District layer, and "Red Light Cameras" for the red light camera traffic violations layer.
Size and position: Here the size and position of the legend can be changed.
Font settings: Specific font type and font size can be determined here.
Border: An option to draw a border around the legend.
Legend window for the vector layer in GRASS.
Adding a Scale Bar
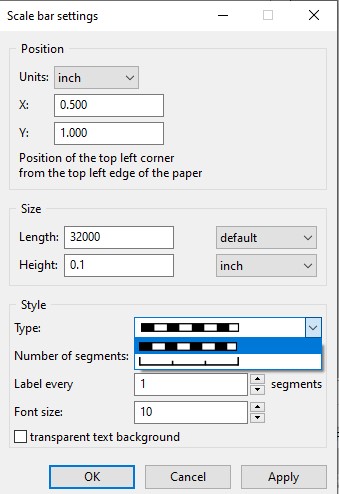
Next, add a scale bar. Navigate to the scale bar settings, where you can adjust the size of the toolbar, the amount of settings, font size, and style of scale bar.
Scale bar settings in GRASS. When you are done setting the options for the scale, click Apply.
Next is to determine the appearance of the map and how the red light camera points will look on the final map product. While we looked earlier at the map display window in GRASS and selected the symbology and the colour of the base layer, these settings do not translate over to the Cartogaphic Composer. You have to specify the symbology again within the Cartographic Composer.
Vector Map Settings
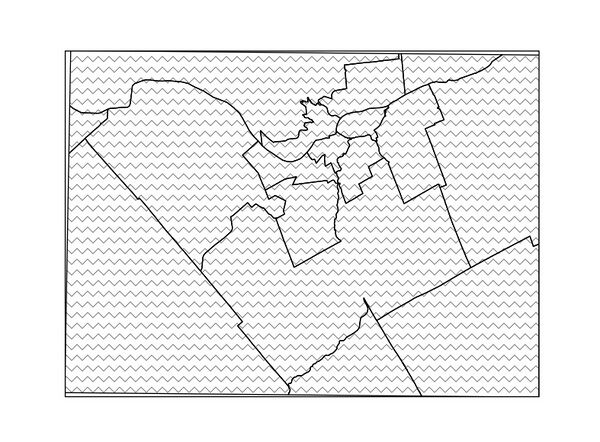
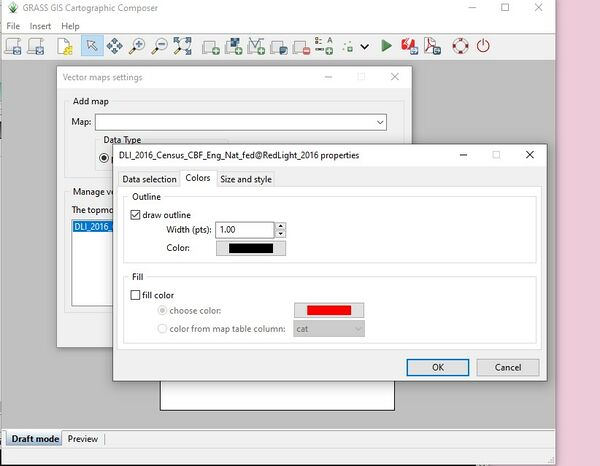
First, select Vector maps settings again in the toolbar. In the Manage vector maps section, highlight either layer and select Properties. First, I will edit the Federal Electoral Districts layer. Within the Properties, you can edit the fill colour, width of the outline (and if a drawn outline is desired) and pattern. If you desire to use a pattern, you can select an (.eps) (Encapsulated PostScript) file to fill the area of the vector layer. GRASS comes with a handful of (.eps) layers. I chose horizontal zig zag layer to fill the vector layer.
The result of the pattern fill in the vector layer.
The vector map settings in GRASS.
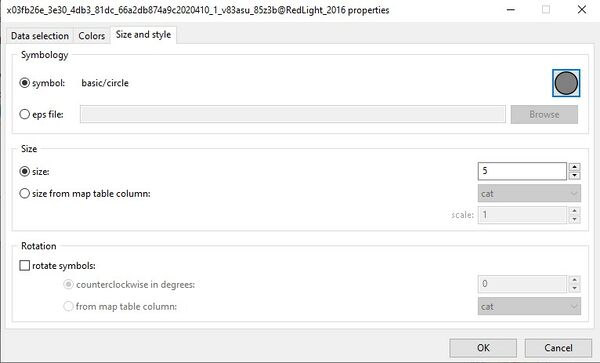
Second, select the red light camera layer. In this layer, you can select the symbology of the points, size of the points, rotation, colour, outline and data selection. However, you cannot label the points. I chose a red circle to demonstrate the location of red light cameras in Ottawa.
Symbology window in GRASS.
Adding a North Arrow
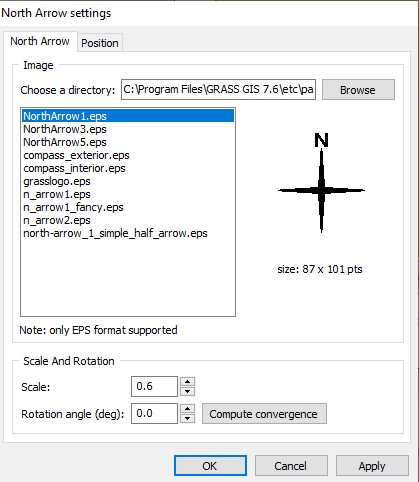
Next, insert a North Arrow into the map. This button is located with the Legend and Scale Bar buttons. There are not many options for the North arrow. You can select the look of the North arrow, scale, rotation angle and position.
The North Arrow window in GRASS.
Adding Text
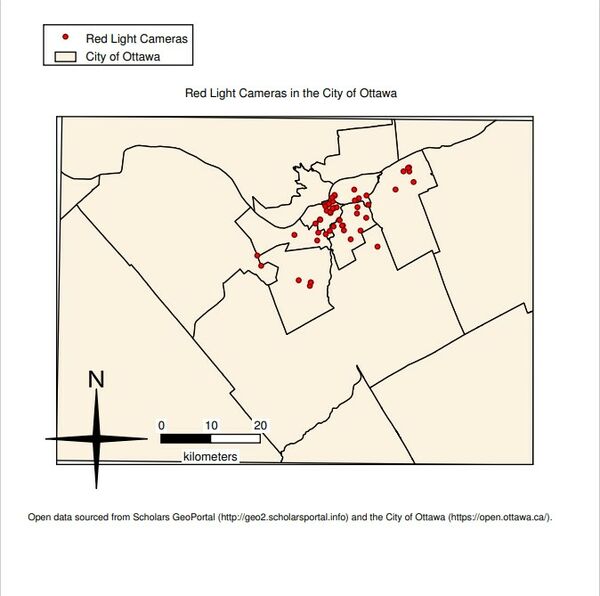
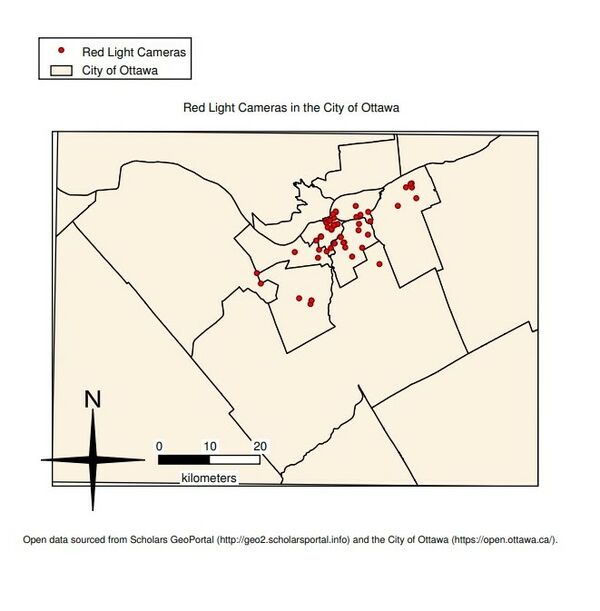
Finally, insert two text boxes: one labelling the map, and another citing where the geospatial data was sourced from. I titled the map "Red Light Cameras in the City of Ottawa". The Composer should look like a bunch of boxes before clicking the Preview button or exporting to PDF. Considering the red light camera layer cannot be symbolized by the attribute TOTAL_VIOL, which demonstrates the amount of violations on a singular camera, the focus of the map will be locations of red light cameras in the City of Ottawa.
Once the Composer has all of the cartographic aspects needed for the map, you can select the green triangle on the toolbar to display a preview of the map or File>Export to PDF. The display will come up in the Preview tab. Sometimes the Cartographic Composer will crash on a Windows machine, and this can be avoided by exporting the map to a PDF.
This is the final map product of the tutorial.
Exporting the Data From GRASS GIS and Importing the Data Into QGIS
The end goal of the tutorial is to export the vector layers from GRASS GIS into QGIS and compare final map products from each.
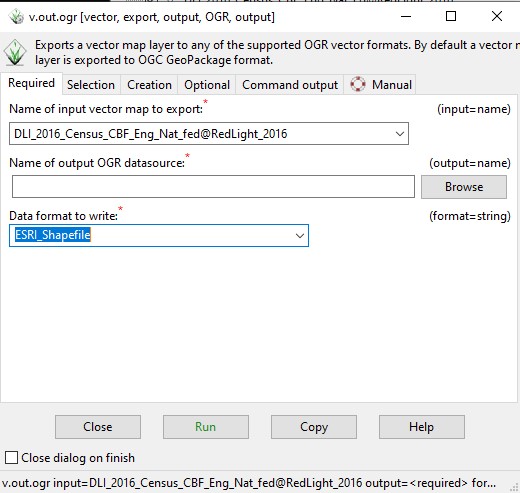
To export vector layers from GRASS, navigate to File>Export vector map>Common export formats. The layers can be exported into many different types of files such as KML, Esri Shapefile, Postgre SQL and GeoJSON. I am going to export my vector files from GRASS GIS as Esri Shapefiles. By default, a vector map is exported to OGC GeoPackage format. The tutorial does not focus on making maps within QGIS. There is another tutorial in the CUOSGwiki called Making Maps that Look Great Using QGIS and Inkscape 1 that goes in depth on how to create maps in QGIS.
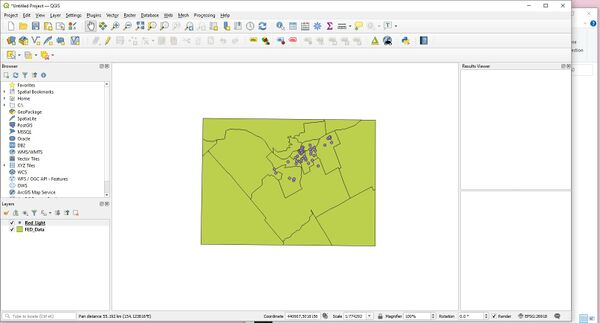
After exporting the files from GRASS GIS and importing them into QGIS, the layers exported from GRASS did not retain their designated symbology or colour settings. The map should look like this:
Map Products
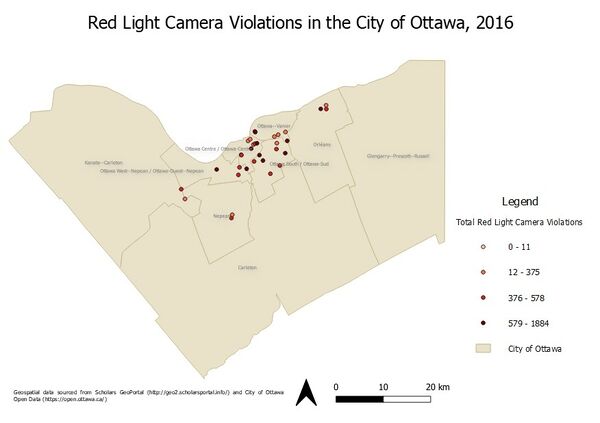
This is a map created in QGIS with the layers extracted from QGIS. I was able to remove the areas outside of the City of Ottawa, add labels to the areas in Ottawa, as well as add graduated symbols to the red light camera layer indicating the total number of violations for the year 2016.
This is the final map made in GRASS to compare with the map created in QGIS.
Conclusion
GRASS GIS is overall a good program to analyze geospatial data. It is open source, fast (compared to other programs like ArcGIS Pro and sometimes QGIS) and can process both raster and vector data. However, it lacks basic cartographic aspects such as labelling attributes in vector layers or symbolizing data (graduated symbols, heat maps, or point cluster for example). The Cartographic Composer may work better with raster data, for example digital elevation maps. However, the flexibility of understanding how to create maps in a variety of programs is a valuable skill.
References
1 Carrick, J. (2018). Making Maps That Look Great Using QGIS and Inkscape. Retrieved from https://dges.carleton.ca/CUOSGwiki/index.php/Making_Maps_that_Look_Great_Using_QGIS_and_Inkscape
