Difference between revisions of "Creating Thematic Maps Using the Cartographic Composer in GRASS GIS"
| Line 58: | Line 58: | ||
As seen in the Map Display, the map colour and the symbology of the map needs to be altered. The next step is to add labels to the subdivisions in the City of Ottawa. To check the attribute data of vector datasets in GRASS, highlight a vector file and click the Attribute Table Manager button on the task manager bar in GRASS. |
As seen in the Map Display, the map colour and the symbology of the map needs to be altered. The next step is to add labels to the subdivisions in the City of Ottawa. To check the attribute data of vector datasets in GRASS, highlight a vector file and click the Attribute Table Manager button on the task manager bar in GRASS. |
||
| − | [[File:Figure 11.jpg| |
+ | [[File:Figure 11.jpg|350px|thumb|center]] |
Task manager button in GRASS (highlighted in blue). |
Task manager button in GRASS (highlighted in blue). |
||
Revision as of 23:48, 6 December 2020
Contents
Introduction
The purpose of this tutorial is to introduce the Cartographic Composer in GRASS GIS and use the Cartographic Composer to create a thematic map demonstrating red light violations in the City of Ottawa in 2016. A map will then be created in QGIS to determine red light violations in the City of Ottawa in 2019 to determine differences in the visual aspects of the final map products. The data used for this tutorial is open data, which is available from the City of Ottawa and Scholars GeoPortal. GRASS GIS version 7.8.4 and 3.14 "Pi" version of QGIS is used during the tutorial.
Link to Open Ottawa data: https://open.ottawa.ca/
Link to Scholars GeoPortal: http://geo2.scholarsportal.info/
GRASS GIS and QGIS are both available for Windows, Linux and MacOS. This tutorial will be performed using a Windows machine.
Link to QGIS website, where you can download the program for all three operating systems: https://qgis.org/en/site/forusers/download.html
Link to GRASS GIS website, where you can download the program for all three operating systems: https://grass.osgeo.org/download/
Obtaining the Data
The data that will be used during this tutorial is a base layer of the City of Ottawa from Scholars GeoPortal and two datasets from Open Ottawa: Red Light Camera Violations 2016 and Red Light Camera Violations 2019. Any open data from the City of Ottawa can be used during this tutorial but this is the specific data that will be used for the purpose of the tutorial.
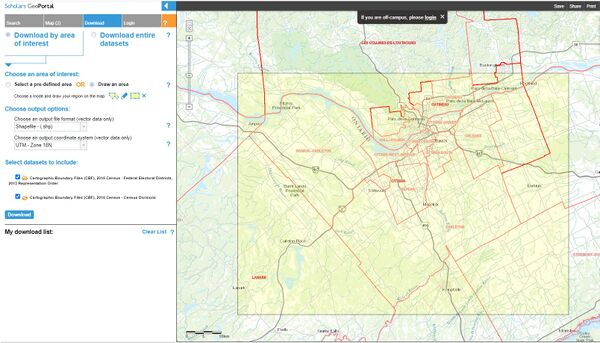
Base layer data of the City of Ottawa selected for the purpose of the tutorial.
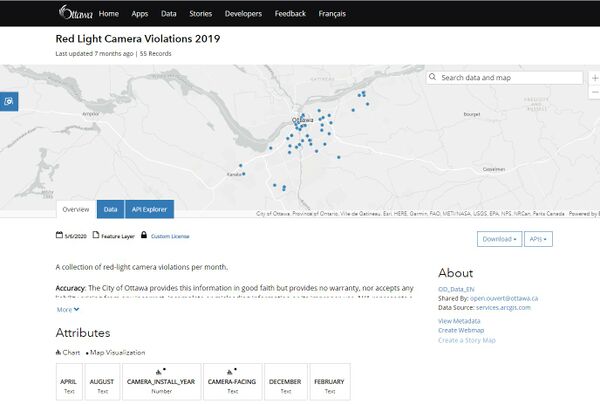
Open data of 2019 red light camera violations downloaded for the purpose of the tutorial.
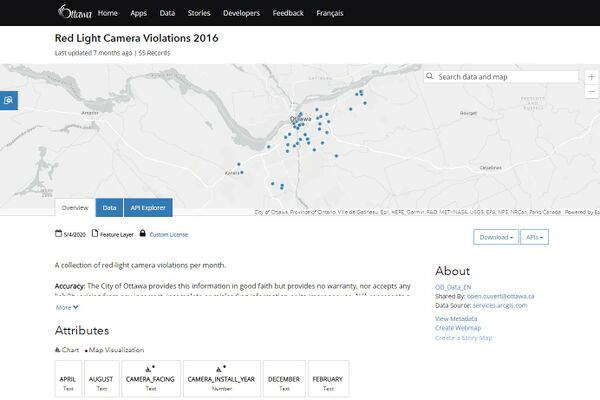
Open data of 2016 red light camera violations downloaded for the purpose of the tutorial.
Once all of the data of your choice has been downloaded, it is ready to be imported into GRASS GIS.
Importing the Vector Data into GRASS GIS
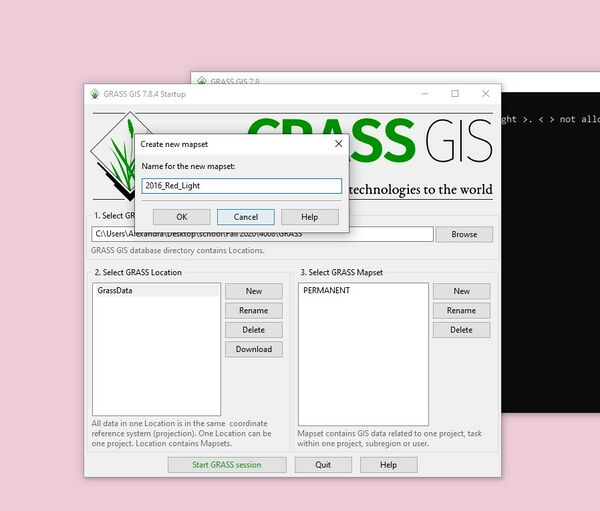
The first step is importing the data into GRASS GIS. Start the program and select the GRASS location desired, and create a new GRASS Mapset. I have created a new mapset in GRASS called 2016 Red Light, which will be the mapset for the 2016 red light violations.
Creating a new mapset in GRASS. When creating a name for the mapset, only ASCII characters can be used. When finished, select Start GRASS session.
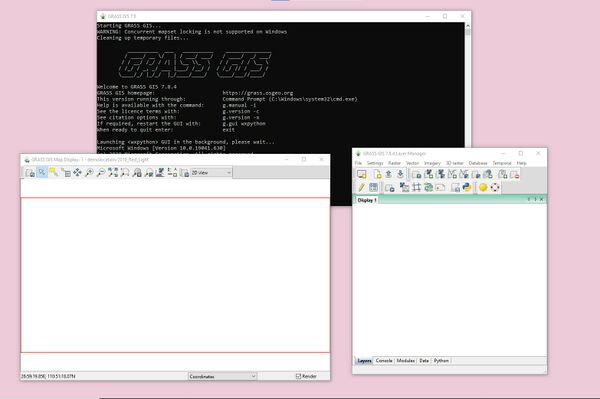
Main screen of GRASS in Windows.
Two files came with the Ottawa boundary shapefile that was downloaded for the City of Ottawa. The first one contains Census Divisions, and the other contains Federal Electoral Districts. Federal Electoral Districts are subdivisions in the City of Ottawa. Including these in the map will allow the user to determine in which subdivision the most red light violations occurred.
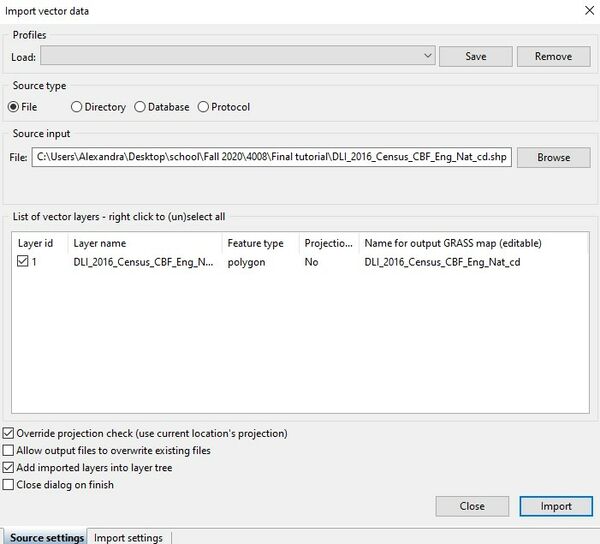
Next, import all three of the vector layers into GRASS GIS, under File>Import vector data>Simplified vector import with reprojection [v.import].
Importing Census Divisions shapefile into GRASS. Make sure to check "Override projection check (use current location's projection)". Click import once the correct file has been selected. Repeat this for the other two files, the Federal Electoral Districts shapefile and the 2016 red light data (or whatever data you have chosen to present on the map).
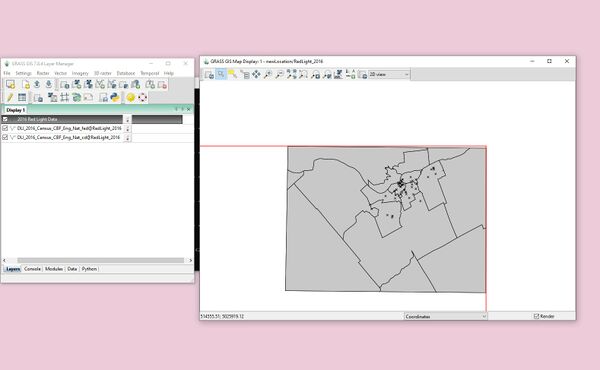
After importing all of the shapefiles, the map display in GRASS should display the City of Ottawa and all of the red light camera violations in 2016. The map demonstrates that the majority of red light camera violations are in Nepean, Downtown Ottawa and East Ottawa.
This is how the map should look in the Map Display in GRASS. Don't worry about the layout, the next section explains how to change the symbology of the red light camera violations and the colour/display of the map.
Editing the Cartographic Aspects of the Map in GRASS GIS
As seen in the Map Display, the map colour and the symbology of the map needs to be altered. The next step is to add labels to the subdivisions in the City of Ottawa. To check the attribute data of vector datasets in GRASS, highlight a vector file and click the Attribute Table Manager button on the task manager bar in GRASS.
Task manager button in GRASS (highlighted in blue).
