Difference between revisions of "User:KennethBatagon"
| Line 22: | Line 22: | ||
==='''Open Data Ottawa'''=== |
==='''Open Data Ottawa'''=== |
||
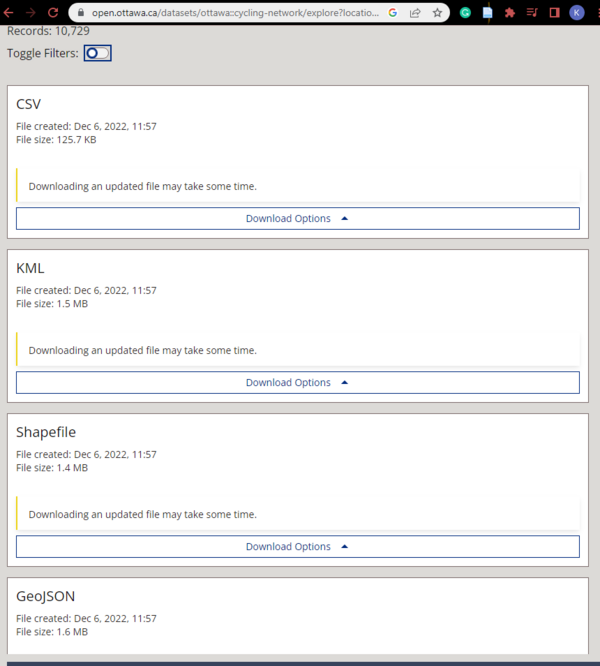
The next data collection can be found in [https://open.ottawa.ca/ Open Data Ottawa]. The Open Data Ottawa platform is part of the City's open data initiative, which aims to make city data more transparent, accessible, and useful to the public. Hence, the shapefiles data we need is going to be extracted here. You will need a polygon shapefile for [https://open.ottawa.ca/datasets/wards-2022-2026/explore?location=45.374588%2C-75.704854%2C4.64 Ottawa Wards], [https://open.ottawa.ca/datasets/ottawa::traffic-collision-by-location-2017/explore?location=45.250365%2C-75.806856%2C1.99 traffic collision] shapefile, [https://open.ottawa.ca/datasets/ottawa::cycling-network/explore?location=45.242102%2C-75.801676%2C1.41 cycling network] shapefile, [https://open.ottawa.ca/datasets/pedestrian-network/explore?location=45.374747%2C-75.677325%2C4.98 pedestrian network] shapefile, and [https://open.ottawa.ca/datasets/road-centrelines/explore?location=45.387504%2C-75.686385%2C4.90 Ottawa roadlines] shapefile. |
The next data collection can be found in [https://open.ottawa.ca/ Open Data Ottawa]. The Open Data Ottawa platform is part of the City's open data initiative, which aims to make city data more transparent, accessible, and useful to the public. Hence, the shapefiles data we need is going to be extracted here. You will need a polygon shapefile for [https://open.ottawa.ca/datasets/wards-2022-2026/explore?location=45.374588%2C-75.704854%2C4.64 Ottawa Wards], [https://open.ottawa.ca/datasets/ottawa::traffic-collision-by-location-2017/explore?location=45.250365%2C-75.806856%2C1.99 traffic collision] shapefile, [https://open.ottawa.ca/datasets/ottawa::cycling-network/explore?location=45.242102%2C-75.801676%2C1.41 cycling network] shapefile, [https://open.ottawa.ca/datasets/pedestrian-network/explore?location=45.374747%2C-75.677325%2C4.98 pedestrian network] shapefile, and [https://open.ottawa.ca/datasets/road-centrelines/explore?location=45.387504%2C-75.686385%2C4.90 Ottawa roadlines] shapefile. |
||
| − | [[File:Example of the shapefile dataset.png|600px|thumb|center|Figure |
+ | [[File:Example of the shapefile dataset.png|600px|thumb|center|Figure 4. This is one of the shapefile datasets you need to download.]] |
| + | |||
| + | ==Project Set up== |
||
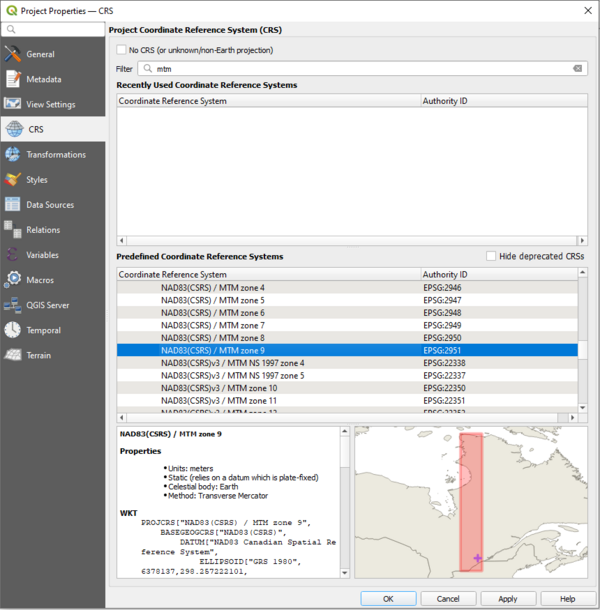
| + | Before doing anything else, we need to set up the project coordinate system so it matches the data we collected from Ottawa shapefiles data. This can be done by clicking on '''Project'''-> '''Project Properties''' -> '''CRS''' and choose '''NAD83(CRS)/MTM Zone 9''' as data of Ottawa suggested. |
||
| + | [[File:Projectsetup.png|600px|thumb|center|Figure 5. Setting up the coordinate system.]] |
||
=='''Calculating the routes using ORS Tools'''== |
=='''Calculating the routes using ORS Tools'''== |
||
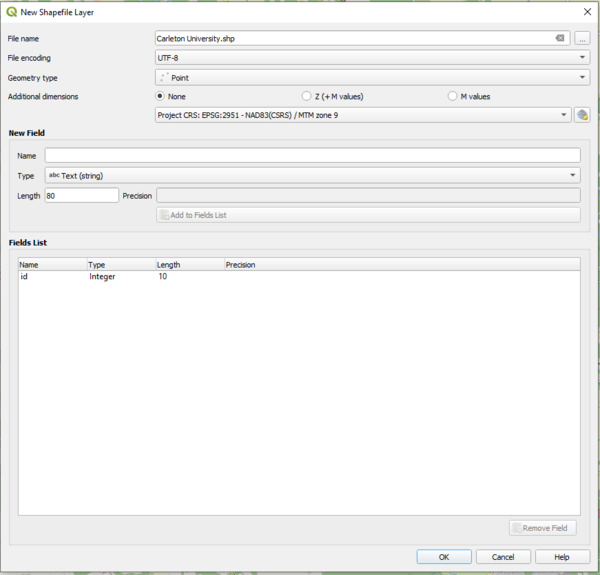
ORS Tools have three options for batch jobs. For this part of the tutorial, we will be working on the direction that calculates the fast and the shortest routes. First, you need to create a point layer as a shapefile ([[File:Point layer shapfile.png|frameless]]) as a setup for your origin and destination point. |
ORS Tools have three options for batch jobs. For this part of the tutorial, we will be working on the direction that calculates the fast and the shortest routes. First, you need to create a point layer as a shapefile ([[File:Point layer shapfile.png|frameless]]) as a setup for your origin and destination point. |
||
| − | [[File:Pointlayersetup.png|600px|thumb|center|Figure |
+ | [[File:Pointlayersetup.png|600px|thumb|center|Figure 6. A set up for point layer as a shapefile]] |
By doing so, it will pop up a point shapefile layer under the ''Layers'' category. Right-click on the newly created layer and click '''Toggle Editing'''. After that, '''Add Point Feature''' |
By doing so, it will pop up a point shapefile layer under the ''Layers'' category. Right-click on the newly created layer and click '''Toggle Editing'''. After that, '''Add Point Feature''' |
||
[[File:Addpointfeature.png|frameless]] |
[[File:Addpointfeature.png|frameless]] |
||
| − | should be available to click. Now begin adding a point feature for the origin point, Carleton University, and find Walmart in Billings Bridge as the destination point as shown in Figure |
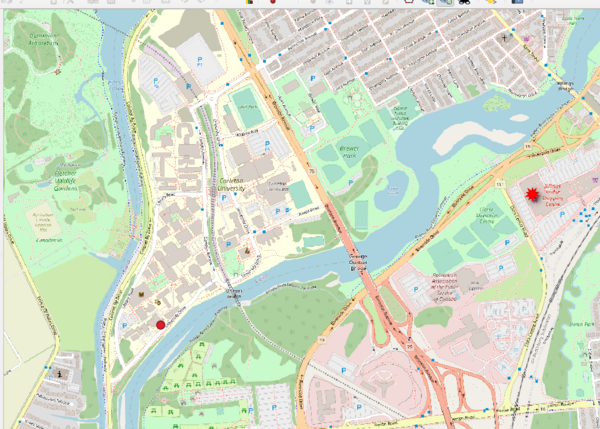
+ | should be available to click. Now begin adding a point feature for the origin point, Carleton University, and find Walmart in Billings Bridge as the destination point as shown in Figure 7. I added my origin layer to Loeb Building as it is our department building. |
| − | [[File:Pointlayers.png|600px|thumb|center|Figure |
+ | [[File:Pointlayers.png|600px|thumb|center|Figure 7. Point Layers for both origin and destination points.]] |
===Fastest Route=== |
===Fastest Route=== |
||
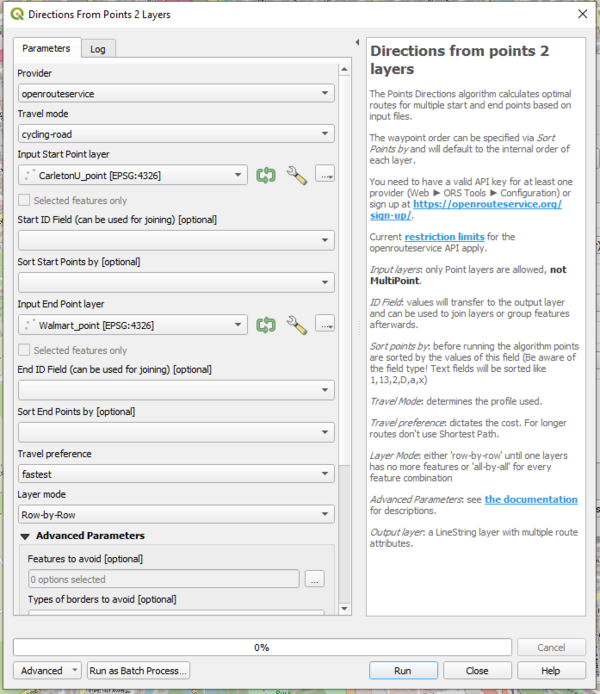
After creating the point layers, it is time to open up ORS Tools. '''Web'''-> '''ORS Tools'''-> '''Batch Jobs'''->'''Points (2 Layer)'''. It should give you an image similar to Figure 6. First, we start with the fastest route. Set Carleton as the '''Input Start Layer''' and '''Walmart''' as the end point layer. Set '''Travel Mode''' to '''cycling-road''' and '''Travel preference''' to '''fastest''' and run it. |
After creating the point layers, it is time to open up ORS Tools. '''Web'''-> '''ORS Tools'''-> '''Batch Jobs'''->'''Points (2 Layer)'''. It should give you an image similar to Figure 6. First, we start with the fastest route. Set Carleton as the '''Input Start Layer''' and '''Walmart''' as the end point layer. Set '''Travel Mode''' to '''cycling-road''' and '''Travel preference''' to '''fastest''' and run it. |
||
| − | [[File:Fastest.png|600px|thumb|center|Figure |
+ | [[File:Fastest.png|600px|thumb|center|Figure 8. 2 points layers to determine the fastest routes.]] |
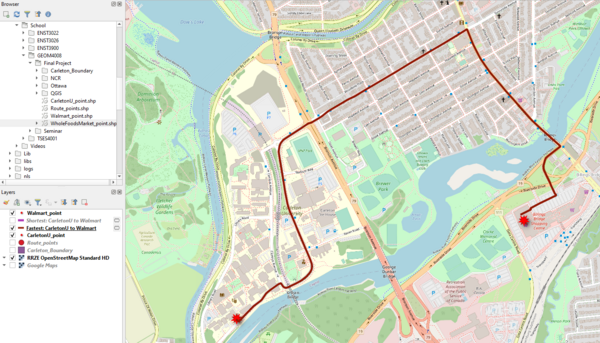
By doing so, you should get the fastest route from Carleton University to Walmart. |
By doing so, you should get the fastest route from Carleton University to Walmart. |
||
| − | [[File:Fastesstroutenew.png|600px|thumb|center|Figure |
+ | [[File:Fastesstroutenew.png|600px|thumb|center|Figure 9. The calculated fastest route from Carleton University to Walmart]] |
===Shortest Route=== |
===Shortest Route=== |
||
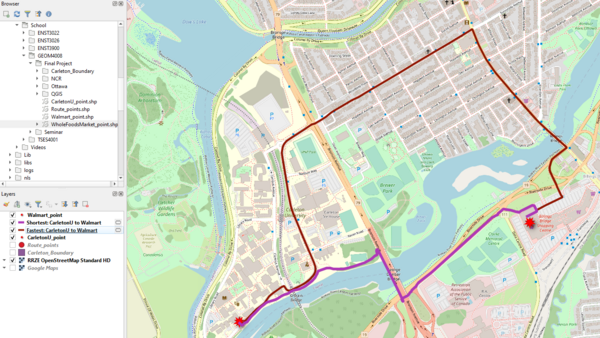
For the shortest route, do the same steps as mentioned above. However, change the '''Travel preference''' to '''shortest'''. You should get the following image: |
For the shortest route, do the same steps as mentioned above. However, change the '''Travel preference''' to '''shortest'''. You should get the following image: |
||
| − | [[File:Fastestroute.png|600px|thumb|center|Figure |
+ | [[File:Fastestroute.png|600px|thumb|center|Figure 10. Map showing fastest and shortest route]] |
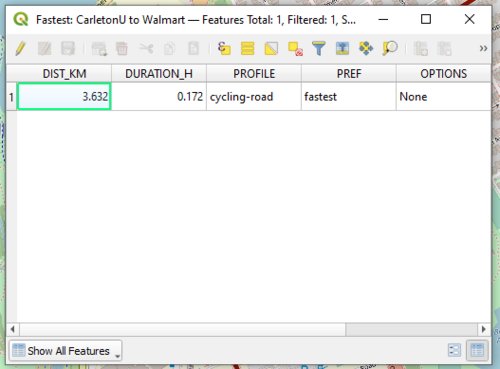
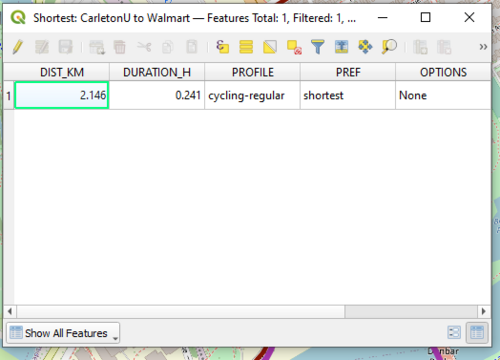
This indicates that the shortest route does not always mean the fastest due to multiple factors such as traffic, traffic lights, and bike routes. This is proven by opening the attributes table for both the fastest and shortest route layers under '''Layers''' category. You can get access to the attribute table by right-clicking the fastest and the shortest route and click '''Open Attribute Table'''. |
This indicates that the shortest route does not always mean the fastest due to multiple factors such as traffic, traffic lights, and bike routes. This is proven by opening the attributes table for both the fastest and shortest route layers under '''Layers''' category. You can get access to the attribute table by right-clicking the fastest and the shortest route and click '''Open Attribute Table'''. |
||
| − | [[File:Fastest.attribute.png|500px|thumb|center|Figure |
+ | [[File:Fastest.attribute.png|500px|thumb|center|Figure 11. Attribute table of the fastest route]] |
| − | [[File:Shortes.attribute.png|500px|thumb|center|Figure |
+ | [[File:Shortes.attribute.png|500px|thumb|center|Figure 12. Attribute table of the shortest route.]] |
Revision as of 21:10, 22 December 2022
Cycling in Carleton University: Calculating Fastest & Shortest Route and Determining Cycling Accidents
Purpose
The purpose of this tutorial is to present the user with open-source data available using QGIS. Introduction. An open-source approach is a way of software product development and distribution in which the public is given free access to the source code. This enables users to access, change, and redistribute the programme in accordance with their requirements and preferences.
Introduction
The purpose of finding the shortest and fastest route between two points is to save time and reduce the cost of travel. This can be useful for individuals planning a trip and businesses or organizations that need to transport goods or people efficiently. For example, this tutorial calculates the shortest and fastest routes from an origin point, Carleton University, to the destination point, Walmart. For this tutorial, determining cycling collisions in the Carleton University and Walmart area helps to identify safe and efficient routes for cycling. This tutorial will use QGIS as it is a powerful and versatile GIS software that is widely used for mapping, spatial analysis, and data visualization.
Data Collection and Organization
QGIS
The first step for this tutorial is to get QGIS access. If you are using the school’s computer, you can skip this part.
QGIS Plugins
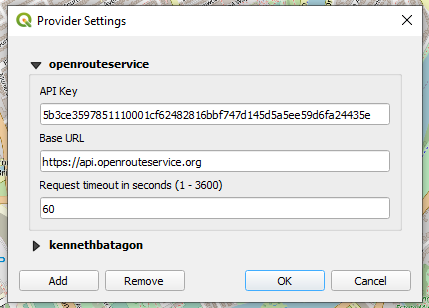
In order to calculate the fastest and shortest route, you will need to download a plugin within QGIS called ORS Tools (Open Route Service). The majority of the OpenStreetMap-based openrouteservice.org features are accessible through ORS Tools. Routing, isochrones, and matrix calculations are all part of the toolset and can be done interactively in the map canvas or via point files within the processing framework. Several attributes, including duration, length, and start/end locations, are set for output files. To do this, click Plugins -> Manage and Install Plugins and search for ORS Tools and install it. Once installed, proceed toward Web-> ORS Tools-> Provider Settings to request an API key. This is a crucial step as any parameters or actions you want to do will not work without the key. You will need to signup by searching open route service sign up or by clicking this link. Follow the instructions given in the email.
The second plugin is QuickMapServices. It serves as an accessible base map that perfectly complements the previous plugin, ORS Tools. As mentioned above, you will need to install this plugin through Plugins -> Manage and Install Plugins and search for QuickMapServices and install it. Follow the steps in Figure 3 and you should have a search menu on the right side of QGIS. Search up your preferred basemap. For this tutorial, I used RRZE OpenStreetMap Standard HD. After you clicked it, you should have the basemap under Layer on the left side of QGIS.
Open Data Ottawa
The next data collection can be found in Open Data Ottawa. The Open Data Ottawa platform is part of the City's open data initiative, which aims to make city data more transparent, accessible, and useful to the public. Hence, the shapefiles data we need is going to be extracted here. You will need a polygon shapefile for Ottawa Wards, traffic collision shapefile, cycling network shapefile, pedestrian network shapefile, and Ottawa roadlines shapefile.
Project Set up
Before doing anything else, we need to set up the project coordinate system so it matches the data we collected from Ottawa shapefiles data. This can be done by clicking on Project-> Project Properties -> CRS and choose NAD83(CRS)/MTM Zone 9 as data of Ottawa suggested.
Calculating the routes using ORS Tools
ORS Tools have three options for batch jobs. For this part of the tutorial, we will be working on the direction that calculates the fast and the shortest routes. First, you need to create a point layer as a shapefile (![]() ) as a setup for your origin and destination point.
) as a setup for your origin and destination point.
By doing so, it will pop up a point shapefile layer under the Layers category. Right-click on the newly created layer and click Toggle Editing. After that, Add Point Feature
![]() should be available to click. Now begin adding a point feature for the origin point, Carleton University, and find Walmart in Billings Bridge as the destination point as shown in Figure 7. I added my origin layer to Loeb Building as it is our department building.
should be available to click. Now begin adding a point feature for the origin point, Carleton University, and find Walmart in Billings Bridge as the destination point as shown in Figure 7. I added my origin layer to Loeb Building as it is our department building.
Fastest Route
After creating the point layers, it is time to open up ORS Tools. Web-> ORS Tools-> Batch Jobs->Points (2 Layer). It should give you an image similar to Figure 6. First, we start with the fastest route. Set Carleton as the Input Start Layer and Walmart as the end point layer. Set Travel Mode to cycling-road and Travel preference to fastest and run it.
By doing so, you should get the fastest route from Carleton University to Walmart.
Shortest Route
For the shortest route, do the same steps as mentioned above. However, change the Travel preference to shortest. You should get the following image:
This indicates that the shortest route does not always mean the fastest due to multiple factors such as traffic, traffic lights, and bike routes. This is proven by opening the attributes table for both the fastest and shortest route layers under Layers category. You can get access to the attribute table by right-clicking the fastest and the shortest route and click Open Attribute Table.

