Creating Interferogram for Mapping Earthquake Deformation by using Sentinel-1 Data in SNAP
Introduction
Interferometric synthetic-aperture radar (also known as InSAR) is a remote sensing technique of satellite radar. It uses two and more SAR images to create DEM (digital elevation map) in surface deformations based on phase differences, so this technique can be used to monitor hazard Response like earthquake deformation and landslides, volcanic Eruptions and tornado damage.
Synthetic aperture radar (SAR) is an active radar and Sentinel-1 is the first of the Copernicus Programme satellite constellation launched by the European Space Agency, which provides providing continuous all-weather, day-and-night imagery at C-band, weather conditions like clouds won't affect the quality of image. Active radar doesn't need illumination from sun, the sensor of satellite can transmit signal and receive backscattered signal shortly, which means it uses the difference between the phase signals from repeatedly detecting earth surface to monitor surface deformation and landcover changes, in another word, the phase differences are from two different observations with minor different sensor position. After combining two images in coregistration step, a basic interferogram will be created.
In this tutorial, we will create two interferograms from two earthquake examples: 2016 Kaikoura earthquake (New Zealand) and 2017 Iran–Iraq earthquake, whose magnitudes are 7.8 and 7.3 respectively, each example has a paired Sentinel-1 data, including image before earthquake and image after earthquake.
Background Information
The 2016 Kaikoura earthquake was a magnitude 7.8 (Mw) earthquake in the South Island of New Zealand that occurred two minutes after midnight on 14 November 2016 NZDT (11:02 on 13 November UTC). Ruptures occurred on multiple faults and the earthquake has been described as the "most complex earthquake ever studied". Wikipedia-2016 Kaikoura earthquake
On 12 November 2017 at 18:18 UTC (21:48 Iran Standard Time, 21:18 Arabia Standard Time), an earthquake with a moment magnitude of 7.3 occurred on the Iran–Iraq border, with the Iraqi Kurdish city of Halabja, and the Kurdish dominated places of Ezgeleh, Salas-e Babajani County, Kermanshah Province in Iran, closest to the epicentre, 30 kilometres (19 mi) south of the city of Halabja, Iraqi Kurdistan. Wikipedia-2017 Iran–Iraq earthquake
Brief explanation of interferogram: The coloured fringes map the deformation of the surface of the Earth in the direction of the view from the satellite in units of the radar wavelength (2.8 cm) between colour cycles. esa-interferometry
Sentinel-1 Data and Software
| Data | Data Time | Data Download Link |
|---|---|---|
| Before 2016 Kaikoura earthquake | 2016 Nov. 03 | esa download link Full name: S1A_IW_SLC__1SSV_20161103T072220_20161103T072250_013774_0161F9_2F68. |
| After 2016 Kaikoura earthquake | 2016 Nov. 15 | esa download link Full name: S1A_IW_SLC__1SDV_20161115T072214_20161115T072244_013949_016775_84CF. |
| Before 2017 Iran–Iraq earthquake | 2017 Nov. 11 | esa download link Full name: S1A_IW_SLC__1SDV_20171111T150004_20171111T150032_019219_0208AF_EE89. |
| After 2017 Iran–Iraq earthquake | 2017 Nov. 17 | esa download link Full name: S1B_IW_SLC__1SDV_20171117T145926_20171117T145953_008323_00EBAB_AFB8. |
| System Requirements | SNAP Download |
|---|---|
|
Sentinel-1 Toolbox - The current version is 7.0.0 (22.07.2019 13:30 UTC).
Download Link (Version depends on your working environment!) |
Data Processing
Step 1: Start software and open data
- First, we open the SNAP after you have successfully installed it and then download four Sentinel-1 data from the above links, once you have prepared all materials
- then we can open ZIP files in Open Product in SNAP as screenshots show
- click Open to add the data in SNAP. You can view your data in Product Explorer window and check each band.


Steps2: Split data
Then we open Split tool for each ZIP file

- For data of 2016 Kaikoura earthquake
- we use IW2, VV and burst from 6 to 9 for S1A_IW_SLC__1SSV_20161103T072220_20161103T072250_013774_0161F9_2F68.
- then use IW2, VV and burst from 7 to 10 for S1A_IW_SLC__1SDV_20161115T072214_20161115T072244_013949_016775_84CF.


- For data of 2017 Iran–Iraq earthquake
- we use IW2, VV and burst from 5 to 8 for S1A_IW_SLC__1SDV_20171111T150004_20171111T150032_019219_0208AF_EE89.
- then use IW2, VV and burst from 4 to 7 for S1B_IW_SLC__1SDV_20171117T145926_20171117T145953_008323_00EBAB_AFB8.


Step3: Apply Orbit File
We apply orbit file for each split data
- go to find Radar -> Apply Orbit File and leave with default settings, click Run for each split file

Step4: Coregistration
For creating interferogram, it requires two or more images to be coregistered, one image is master image and others are slaves
- Go to find Radar -> Coregistration -> S1 TOPS Coregistration -> S-1 Back Geocoding

- then use the add and delete bottons on the left of toolbox to select your split data with orbit file

- After selecting yor files, click Run botton with default settings

NOTE: IW must be same in producing coregistration when spliting data.
- Once done, you will get two data for each earthquake example, like this
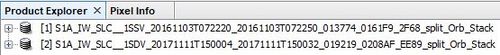
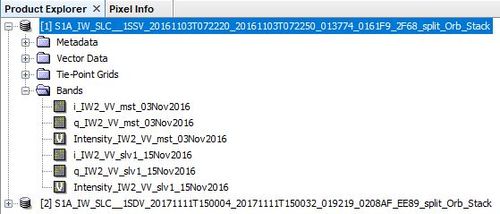
- [1] is 2016 Kaikoura earthquake;[2] is 2017 Iran–Iraq earthquake


- The file suffix will be: _split_Orb_Stack
Step5: Interferogram Formation
The interferogram is to generate the phase difference map, so both images (master and slave ) will be multiplied with their different phases.
The interferometric fringes means 2π cycle of phase change with surface difference, which will be represented in a color cycle, so when frinage is denser, the deformation will be stronger.
- Go to find Radar -> Interferometric -> Products -> Interferogram Formation

- Select both coregistered files respectively and click Run with default settings

- The file suffix will be: _split_Orb_Stack_ifg

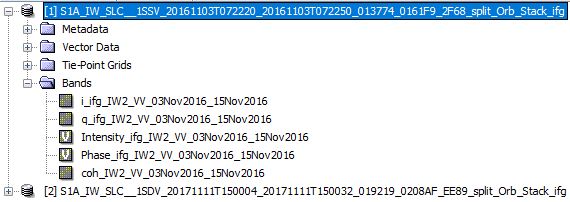
- [1] is 2016 Kaikoura earthquake; [2] is 2017 Iran–Iraq earthquake

- You can preview the phase map by clicking
Phase_ifg_
inBand
- Here is exampled preview of Phase map of 2016 Kaikoura earthquake:
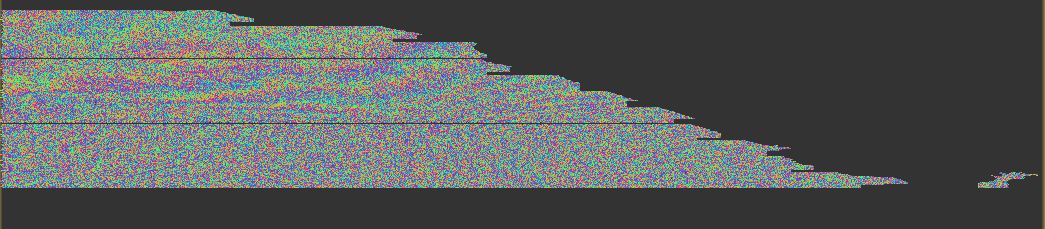
- [NOTE: This is not the final output of interferogram !!]
- Here is exampled preview of Phase map of 2016 Kaikoura earthquake:

Step6: Deburst
This step is to join each burst we selected in a single image
- Go to find Radar -> Sentinel-1 TOPS -> S1 TOPS Deburst
- Select file for each example, click Run with default settings
- The file suffix will be:_split_Orb_Stack_ifg_deb

- [1] is 2016 Kaikoura earthquake; [2] is 2017 Iran–Iraq earthquake

Step7: Topographic Phase Removal
To remove the interference from topography for mapping phase difference in the interferogram,
this step is to remove known DEM when processing data.
- Go to find Radar -> Interferometric -> Products -> Topographic Phase Removal

- Select interferogram file for each example and click Run with default settings
- The file suffix will be:_split_Orb_Stack_ifg_deb_dinsar

- [1] is 2016 Kaikoura earthquake; [2] is 2017 Iran–Iraq earthquake