Difference between revisions of "Determining Effects on Temperature Interpolations from Large Lakes using QGIS"
| Line 27: | Line 27: | ||
Before the interpolation can be completed the interpolation plugin needs to be added to QGIS. This can be done through the manage and install plugin tab (Plugins/Manage and Install Plugin). Search "interpolation" in the search tab, and check the box to add the plugin. |
Before the interpolation can be completed the interpolation plugin needs to be added to QGIS. This can be done through the manage and install plugin tab (Plugins/Manage and Install Plugin). Search "interpolation" in the search tab, and check the box to add the plugin. |
||
| − | [[File:Plugin.png| |
+ | [[File:Plugin.png|500px]] |
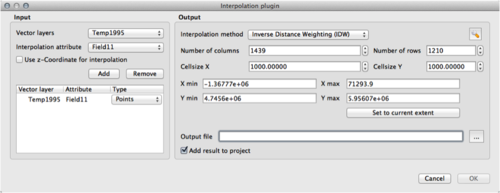
The interpolation can now be created through the interpolation tool (Raster/Interpolation/Interpolation). There will be a number of options that will need to be addressed in this section. The vector layer must be set to your point data used for the interpolation (the 1995 temperature data in this project). The Interpolation Attribute must be set to the field used for the interpolation values (i.e. the temperature field in the data, which is field 11). Then click the add button directly below this field. Switch the interpolation method to Inverse Distance Weighting (IDW). The Cellsize X and Y is the pixel size for the raster image being produced. I used a cellsize of 1000 for both, but feel free to experiment to determine what is ideal for your project (Note: The pixel size being used will have an overall impact on the error developed through this interpolation). Finally select an output file name and select the folder used to contain the rest of your data to save the interpolation in. The remaining fields not mentioned can be left as is. |
The interpolation can now be created through the interpolation tool (Raster/Interpolation/Interpolation). There will be a number of options that will need to be addressed in this section. The vector layer must be set to your point data used for the interpolation (the 1995 temperature data in this project). The Interpolation Attribute must be set to the field used for the interpolation values (i.e. the temperature field in the data, which is field 11). Then click the add button directly below this field. Switch the interpolation method to Inverse Distance Weighting (IDW). The Cellsize X and Y is the pixel size for the raster image being produced. I used a cellsize of 1000 for both, but feel free to experiment to determine what is ideal for your project (Note: The pixel size being used will have an overall impact on the error developed through this interpolation). Finally select an output file name and select the folder used to contain the rest of your data to save the interpolation in. The remaining fields not mentioned can be left as is. |
||
| − | [[File:Interpolation.png| |
+ | [[File:Interpolation.png|500px]] |
==Conclusion== |
==Conclusion== |
||
Revision as of 13:29, 21 December 2015
Contents
Purpose
The purpose of this tutorial is to provide the steps necessary for creating an Inverse Distance Weighting (IDW) interpolation in QGIS, and then how to analyze the errors generated spatially. More specifically, you can interpret these errors with proximity to features (large lakes in this project) to see how the distance to a lake affects the error in the interpolation.
Introduction
An Inverse Distance Weighted (IDW) Interpolation uses surrounding known points (i.e. elevation) to estimate point values across an area, using the known points values. The IDW takes the distance away from the surrounding points to determine the estimated values. With the creation of this IDW interpolation, error is created because the interpolation is only estimated values across the area. It is known that lakes have a moderating effect on temperature, and so this project seeks to assess the impact on error of interpolations, rather than on temperature. This project has unlimited uses outside of lake effect as well, as you could analyze urban areas, forests, or any other type of feature/land type and its effect on quantitative values.
Software
The software used for this project was QGIS, which is a free and open-sourced GIS software. This tutorial was completed on Mac OS X, but will work with other operating systems as well. The software can be downloaded here https://www.qgis.org/en/site/forusers/download.html
Data
The data used in this tutorial includes a shapefile of large lakes within Ontario, a shapefile of Ontario, and temperature data for Ontario represented as point data. The data used can be found freely online to use in QGIS, and this tutorial will work for any point values wanted to use for interpolation.
Tutorial
Adding Data
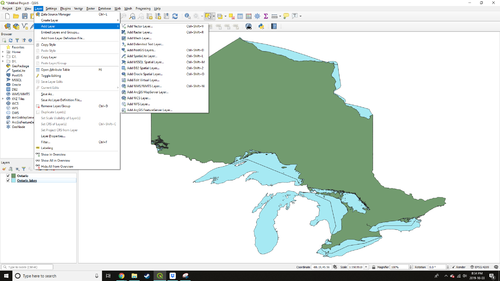
After downloading the QGIS with the link posted above, the first thing that needs to be done is uploading the data into the program. This can be done by using the Add Raster Layer or Add Vector Layer tools, depending on the type of data being used. For the case of this specific project, the data is in vector format (polygons and points) and the vector tool will be used. (Layer/Add Layer/Add Vector Layer)
Note: It is wise to keep all needed data in one folder, and save all of the following data to the same folder as well.
Interpolation
Before the interpolation can be completed the interpolation plugin needs to be added to QGIS. This can be done through the manage and install plugin tab (Plugins/Manage and Install Plugin). Search "interpolation" in the search tab, and check the box to add the plugin.
The interpolation can now be created through the interpolation tool (Raster/Interpolation/Interpolation). There will be a number of options that will need to be addressed in this section. The vector layer must be set to your point data used for the interpolation (the 1995 temperature data in this project). The Interpolation Attribute must be set to the field used for the interpolation values (i.e. the temperature field in the data, which is field 11). Then click the add button directly below this field. Switch the interpolation method to Inverse Distance Weighting (IDW). The Cellsize X and Y is the pixel size for the raster image being produced. I used a cellsize of 1000 for both, but feel free to experiment to determine what is ideal for your project (Note: The pixel size being used will have an overall impact on the error developed through this interpolation). Finally select an output file name and select the folder used to contain the rest of your data to save the interpolation in. The remaining fields not mentioned can be left as is.


