Difference between revisions of "Exploring the Hydrological Tools in QGIS"
| Line 23: | Line 23: | ||
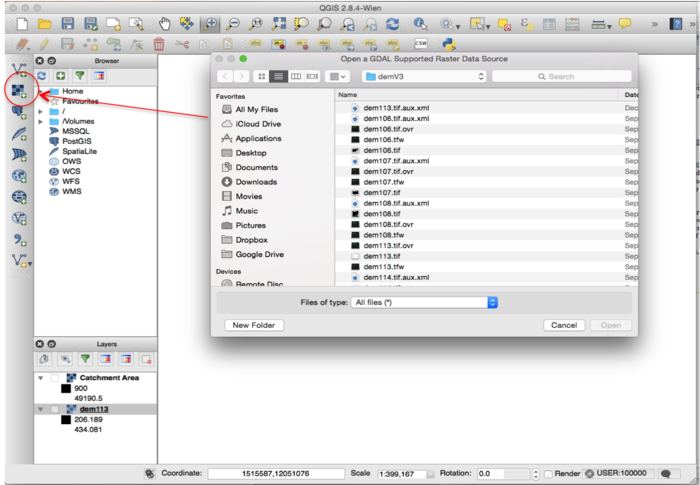
Import your DEM dataset by clicking on the “add raster tool” (Red arrow) and choosing the data in your workplace. Note: The file must be in raster format; for example, .GRID, .tiff, .rst. |
Import your DEM dataset by clicking on the “add raster tool” (Red arrow) and choosing the data in your workplace. Note: The file must be in raster format; for example, .GRID, .tiff, .rst. |
||
| − | [[File:getting_started.png|700px| |
+ | [[File:getting_started.png|700px|thumb|left|Figure 1. QGIS interface. Importing a DEM dataset using the import raster tool.]] |
=== Projecting your DEM === |
=== Projecting your DEM === |
||
Revision as of 16:28, 10 December 2015
Purpose
The purpose of this Wiki tutorial is to demonstrate and explore various hydrology tools used for hydrological analyses in QGIS. The objective of this tutorial is to provide instructions on how to use digital elevation models (DEM) for extracting channel networks, delineating watersheds and defining a catchment area. Additionally, this tutorial will allow for comparison between open source softwares of QGIS, ILWIS and SAGA GIS, tutorials created for hydrological analyses in 2013 and 2014.
Introduction
Hydrological analysis tools are important resources and are used in a variety of programs to define how the geographic range of an area interacts with water. Hydrological analyses can aid researchers and emergency personal in identifying the source and pathway of groundwater, delineating watersheds and identifying communities prone to flooding conditions (Sui et. al., 2011, Mani et al., 2014). A variety of programs can be used to perform hydrological analyses including ARCGIS, ILWIS and SAGA GIS. This tutorial will give instructions on using QGIS, a Free and Open Source Software for Geospatial Data (FOSS4G), for hydrogeological analyses. QGIS is an open source geographic information system that runs on various platforms including Windows, Mac OS and Linux (QGIS, 2015). Using a digital elevation modeling of the West Ottawa region, we will demonstrate and explore hydrogeology toolsets offered by QGIS.
Materials and methods
Data and available platforms
QGIS is a free and open source geographic information system. The current version of QGIS is 2.12.1 ‘Lyon’ that was released on November 27, 2015. QGIS is available for a variety of platforms including Windows, Mac OS, Linus and Android. Various releases for download can be found at [1].
Digital elevation models (DEM) are used for hydrological analyses. DEMs can be generated using point data sets from elevation data or from aerial imagery using remotely sensed data (NRCAN, 2013). Downloading a point data set would generally require interpolation of the data to create a DEM. Interpolation of a DEM will not be discussed in this tutorial. Instead, we will explore the hydrological toolset using a DEM that has previously been interpolated.
A DEM of the southeastern quadrant of the outskirts of Ottawa, Ontario was used for the purpose of this tutorial. Data was obtained from the GIS Department of Carleton University using a data set from the Ontario Ministry of Natural Resources that consisted of a 3-dimensional raster data set. The data captures terrain elevations and covers the province of Ontario with a cell resolution of 30cm.
Additional data sources can be found from Natural Resources Canada, Geogratis and from the provincial website of Ontario.
Getting started
Create a working directory for keeping all your data and progress files. Download the latest version of QGIS for your desired platform and open the program.
Import your DEM dataset by clicking on the “add raster tool” (Red arrow) and choosing the data in your workplace. Note: The file must be in raster format; for example, .GRID, .tiff, .rst.
Projecting your DEM
Assigning a projection to your DEM enables it to be properly displayed and analyzed. To project your DEM in QGIS, follow the below instructions.
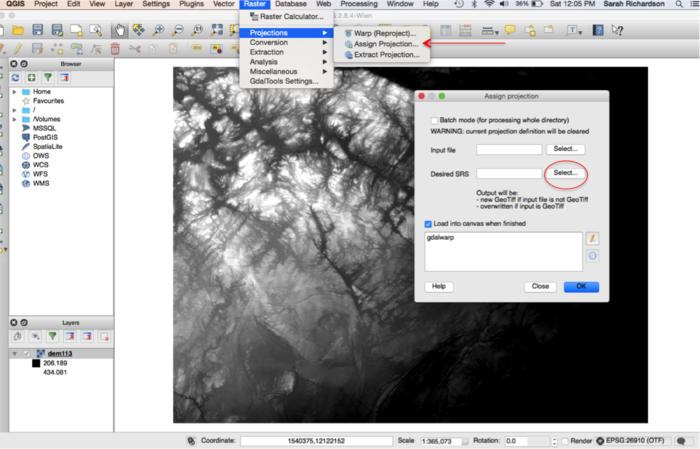
1. Click Raster > Projection > Assign Projection (Figure 2)
2. The Assign Projection window will appear > Click select, Desired SRS > Choose desired coordinate system and click > OK (Figure 3)
3. For the purpose of this tutorial we will be using NAD83, UTM zone 10N
4. Right mouse clicking over your DEM layer > Properties > General > Coordinate reference system Here is where you can verify the projected coordinate system applied to your DEM layer.
5. Reclassify your DEM > Right mouse clicking over your DEM layer > Properties > Style > Render Type > Choose Single Band Pseudocolour > Classify > Click OK.

