Downloading, Visualizing and Preprocessing Sentinel-2 Data in SNAP
Contents
Introduction
Sentinel Application Platform, or SNAP is an earth observation data processing tool which allows for the analysis of satellite imagery data. SNAP was created by Copernicus ESA (European Space Agency) to allow for the processing, visualizing and transforming of data. After its inception in 2014 followed by its first released in 2015, SNAP continues to grow to fill the needs if the growing earth explorer community. It goes from open-source toolboxes, such as BEAM and NEST toward more advanced functions and processing capabilities for optical Synthetic Radar (SAR) data from Sentinel 1, 2, and 3 as well as other mission https://step.esa.int/main/download/snap-download/previous-versions/. The last update, SNAP 12.0.0, released on May 8th 2025 is introducing substantial updates to SAR, optical, and atmospheric data processing workflows.
SNAP is a lesser known tool that is powerful, easily accessible and freely available, making it a great beginner tool for users. SNAP also has Python integration which can help optimize the importation and analytical processes if the user has experience with the language.
Copernicus provides free-of-cost access to Sentinel data, in raw and preprocessed formats. In this tutorial we will be making use of Copernicus data and software to explore some pre-processing and interpretation tools. Specifically, data retrieved from the Sentinel-2 constellation at a 1C pre-processing level. Examples in this tutorial are located on the southern tip of Ireland and ingested on November 2nd, 2021. However, this tutorial facilitates any Sentinel-2 scene and encourages you to explore your region or area of interest while developing your remote sensing and SNAP usage skills.
Getting Started
Install Required Software
A comprehensive guide through the installation can be found below. this is an excerpt taken from the Basic Processing of Radarsat-1 data in Snap ESA tutorial.
SNAP ESA software can be downloaded at the following link [1]. Click the Download link in the Sentinel Toolboxes row that corresponds to your OS. Once the installer is downloaded, follow the instructions to install the software package onto your computer. When the portion of the installer asking to configure the Python library appears, skip this section as it will not be used in this tutorial or for most small processing scenarios. (Fitpatrick & Hamilton, 2021). Note windows defender might block the installation process. In that case just turn it off for the time of the installation.
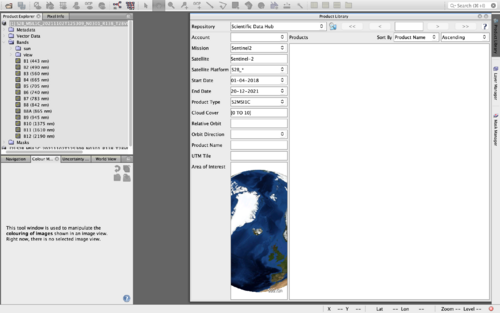
Once installation is complete, open SNAP. The default configuration is illustrated in Figure 1.
Why do we need to take these steps
Satellite data are extremely useful, once they have been processed and interpreted to reveal the underlying meaning and inferences. Raw data must be corrected for implicit and operational errors like orbit related and wavelength interpretation, so accurate and meaningful analyses can be conducted. The tools and processes in this tutorial will give you the knowledge and steps necessary to effectively explore and interpret multispectral data.
Getting Sentinel-2 Data
There are two ways outlined in this tutorial to access Sentinel-2 data, through two Copernicus data servers, Scientific Data Hub and SNAP Product Library.
Copernicus account
To create a Copernicus account:
- Navigate to the Copernicus open access hub through this link scibub.
- Click the person icon with a question mark located in the upper right hand corner of your screen (Figure 2).
- In the lower left corner of the drop down, click Sign Up and fill out all the necessary fields of the corresponding forms, being sure to enter a valid email address.
- Once your account has been created and validated, sign in using the same dropdown in step 3.
We now have access to our Copernicus account and therefore Sentinel data. For more help, this link provides a comprehensive overview of the steps necessary SciHub Help
Scientific Data Hub (SCI Hub)
In Figure 2 we see the default SCI Hub display. depending on the data we are looking for, we are able to filter our search by location, sensor, and in Sentinel-2's case, even satellite. Below the login icon there are three icons oriented vertically (Figure 2) The top one shows the map layers. Click through the options and note the Sentinel-2 Cloudless + Overlay. The second and third icons are in a slider format. the upper icon allows for navigation around the globe. Use this to find your area of interest. Once found, switch the slider to the lower icon. This setting allows you to select an area of interest (AOI), your first filter for Sentinel data.
Next, navigate to the three horizontal lines icon, found on upper left corner of figure 2. This opens the advanced search dropdown, which allows for the filtering of available data by metrics of sensing and ingestion period, mission and the associated characteristics of each mission. After filtering, click the search icon to scan the repository for images that meet both your included location and advanced search criteria.
If any images match your criteria, the advanced search dropdown will be replaced with the results. If you place your mouse over an entry/ result, four icons will appear in the lower right corner of the entry which correspond to
- Zoom to Product,
- View Product Details,
- Add product to Cart,
- Download Product
These are illustrated by the compass, eye, shopping cart and download icons respectively. To find a tile by its location, ensure the Navigation icon from above is activated then click on the tile of interest.
The results list will find and highlight the respective entry. It is recommended to view the product details for a preview of the product before downloading. Once the download is complete, open the product in SNAP. This can be done by the path, File -> Open Product then navigating to your working folder.
SNAP Product Library
The same data found in SCI Hub can be acquired directly in the SNAP application by using the Product Library (Figure 3). A Copernicus account is necessary for this option. However, this option does have the benefit of only utilizing one platform. The product library can be found as a tab on the upper right side of the SNAP console. It may also be found using the path, View -> Tool Windows -> Product Library. Toggle the repository to Scientific Data Hub, Mission to Sentinel-2 and Product type to S2MSI1C. All other entries are specific to the parameters you want to set for your intended data. Figure 3 shows the parameters used for this tutorial. Once all parameters are completed click the search directory button next to the repository name. You may be prompted to enter your Copernicus account information. The bottom border will tell you the progress of the search and outline the amount of entries that coincide with your parameters. Select a tile and download. Once the download is complete, open the product in SNAP. This can be done by the path, File -> Open Product, then navigating to your working folder.
Exploring Data in SNAP
This tab, found in the default view at the lower left corner of the SNAP screen (figure 1) is a very useful tool for data exploration and comparison. This section will provide an overview of its capabilities. If the navigation tab is not immediately apparent, the navigation tab can be opened through this path: View -> Tool Windows -> Navigation. In the right panel of the navigation tab, there are four magnifying glasses and two other special characters:
- The first is the Zoom In icon, which allows for investigation and visualization at a larger scale or higher resolution.
- Next, Zoom Out, which opposes the Zoom In tool.
- The magnifying glass with the 'P' shows the MSI at it highest granular pixel size. In other words the furthest extent one can zoom into the image, to a pixel level.
- The magnifying glass containing an 'A' opposingly yet similarly pans to the furthest extent of the multispectral image (MSI). In other words, by clicking this icon, the image zooms out to show the entire tile or scene.
The next two icons in the line up are extremely useful when comparing two expressions of the same scene. Open two of the image composites explored earlier (like the true colour and and infrared composite). They should be visualized as tabs in your main or major area that you can click between. Then use the path: Window -> Tile Vertically to create a split screen of sorts with both images.
- The first special character synchronizes views across multiple windows, so the exact same frame at the exact same resolution is being shown when panning in one image or in the navigation bar.
- The second synchronizes the cursor across multiple views, so the cursor point in the master tile can be identified easily in the drone/slave tiles.
Both these actions can be used concurrently. This configuration can be used to highlight finer resolution details and help drive analyses.
Note: There are also options to tile horizontally, evenly and singly. Choose the option which best displays the active image.
Preprocessing Sentinel 2 image in SNAP
RGB Exploration
Sentinel-2 Multispectral data has 13 bands which can span from the 443nm to 2190nm on the electromagnetic scale. Any visual representation of a multispectral image (MSI) however can only display three bands at any time, using the Red, Green and Blue colour signatures. It is thus possible to change and manipulate the bands used to understand more about the landscape or focus of the image.
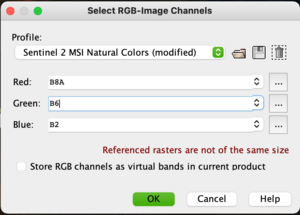
To do this, open an RGB Image Window either by right clicking the file name and scrolling to Open RGB Image Window or by higlighting the product then following the path: Window -> Open RGB Image Window. A popup will appear which outlines the current orientation of bands to colours. A true colour image can be illustrated by matching red: band 4, green: band 3 and blue: band 2 (This should be the default dropdown). Click ok and wait as the RGB image loads. To save this colour composite as a band, check the box next to Store RGB channels as virtual bands in current product. This option is useful when you need to toggle quickly between two composites. Otherwise, the composite will be displayed as a tab in the main window. Play around with the possible colour combinations and think about what the arrangements are telling you.
Improving Sentinel-2 Imagery Spatial Resolution with SEN2RES
The SEN2RES plugin is important because it enhances the spatial resolution of Sentinel-2 imagery, allowing all spectral bands to be analyzed at a uniform 10-meter resolution. Sentinel-2 images have bands at different native resolutions (10m, 20m, and 60m), which can limit the accuracy of vegetation indices, land cover classification, and change detection if lower-resolution bands are directly used. By upsampling the 20m and 60m bands to 10m using SEN2RES, analysts can integrate all bands seamlessly, improving the precision and interpretability of multispectral analyses. This leads to more reliable environmental monitoring, crop health assessment, and urban or land use mapping.
First, download the plugin from the ESA website: SEN2RES plugin . In SNAP, open the Toolbox → Plugins panel, search for “SEN2RES,” and install the plugin using the downloaded file. Note that SEN2RES requires org.netbeans.modules.javahelp (version 2.41.1), which can be downloaded here: plugin . Once installed, the plugin allows users to perform super-resolution processing, upsampling the 20m and 60m bands of Sentinel-2 to match the 10m bands, enabling uniform high-resolution analysis across all spectral bands. This improves the precision of indices, classification, and land cover mapping.
Cloud and Shadow Masking with Idepix
Raw satellite imagery often contains clouds, shadows, or snow, which can distort the analysis. SNAP provides the Idepix plugin to automatically detect and mask these unwanted pixels. To remove Clouds and Shadows it is necessary to install the plugin (if not already installed. To do so
- Go to Tools → Plugins → Available Plugins. Search for Idepix Sentinel-2 MSI and install it. Restart SNAP if required.
Then run the cloud masking:
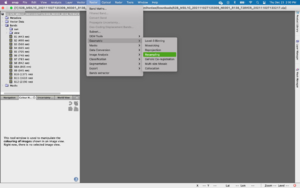
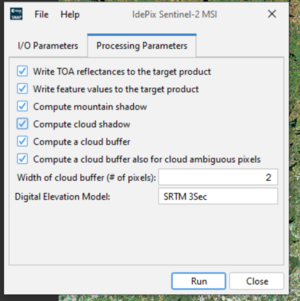
- Go to Optical → Preprocessing → Idepix. Select your input product. Check the option Compute Mountain Shadow. Set the Cloud width threshold (e.g., 5).
- Run the process (figure 5).
The output product is a Sentinel-2 image with clouds and their shadows removed, producing a cleaner dataset ready for further analysis such as vegetation indices, classification, or land cover mapping.
Study area subsetting
Band Extractor in SNAP
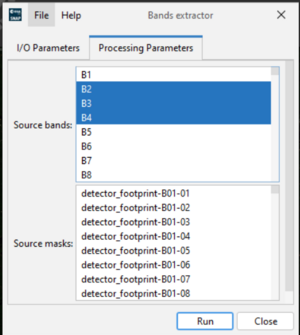
The Band Extractor tool in SNAP is a simple but very important feature that allows you to create a new product containing only the spectral bands you need for your analysis. Instead of working with the full Sentinel dataset (which can be large and contain many unused bands), this tool helps reduce file size and processing time. Some examples of use are extracting B4, B8 to calculate NDVI (Normalized Difference Vegetation Index), extracting B11, B12 for analyzing vegetation stress using SWIR bands and extracting RGB bands (B4, B3, B2) to create a natural color composite. To use the Band Extractor: Open your Sentinel product in SNAP → Go to Raster → Band Maths → Band Extractor. In the dialog box, select the bands you want to extract (for example, B4 – Red, B3 – Green, B2 – Blue). Choose the output directory and name for your new product. Click Run to create the subset with only the selected bands. This process is important because it simplifies your dataset by keeping only the necessary information. By doing this, it improves performance by reducing computation time (figure 6).
Subsetting image
It is beneficial to subset the downloaded Sentinel data package if your AOI is only a portion of the downloaded image. This will increase efficiency, reduce processing time as well as increase clarity of intent.
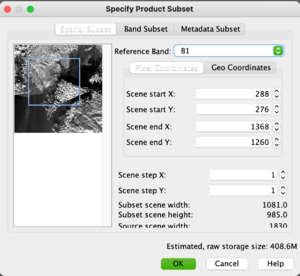
The simplest method is to navigate to Raster toolbar then the Subset option. In the popup window (figure 7) a blue bounding box will appear, this represents the extent of your image or view. Move the edges of the box to your desired location to resize, then press OK. If your desired AOI has exact coordinates or measurements, this option is not the most ideal.
To focus analysis on a specific study area, SNAP 12.0 allow to subset the image based on a polygon. To to that, Go to the Raster tab and select Subset. In the Spatial Subset panel, add your geometric layer (e.g., a shapefile) that defines the Area of Interest (AOI). Make sure the polygon is correctly displayed in the World View on the left, so you have a clear overview of your AOI. Then, in the Band Subset panel, choose only the bands you need for your analysis or final output (for example, B2, B3, B4, and B8 for RGB and vegetation studies). This ensures that the output product is both spatially clipped to your AOI and spectrally reduced to the most relevant bands, making subsequent processing more efficient and targeted.
A few other ways to accomplish a subset are discussed in the Subset section of the Basic Processing of Radarsat-1 data in Snap ESA tutorial found on the main Wiki course page.
Resampling to Increase Usefulness
All bands in the Sentinel-2 product are not of equal resolution, so you may have had trouble combining some bands in your exploration (Figure 8). This is a problem as it restricts analyses and visualization techniques. To combat this, resampling of the bands is conducted using the following steps:
- Navigate to the resampling tool using the path: Raster -> Geometric -> Resampling.
- in the I/O parameters tab, select the product on which the resampling will be conducted. There is also an option to rename the output file, by default it keeps the input name and appends _resampled.
- Select the Resampling Parameters tab. In the section Define size of resampled product, There are three options by which you can determine the resolution of your new product's bands,
- by reference band of source product
- by target width and height
- by pixel resolution
Using the first option, select a visible wavelength band as the reference band, like band 2 or band 3.
- Accept all default parameters for the section Define resampling algorithm.
- A popup will appear notifying of the completed process and its delayed implementation. Click Okay.
- Ensure Resample on pyramid levels (for faster imaging) is checked, then Run.
Image Classification Exploration
Spectrum View
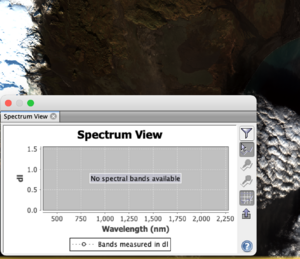
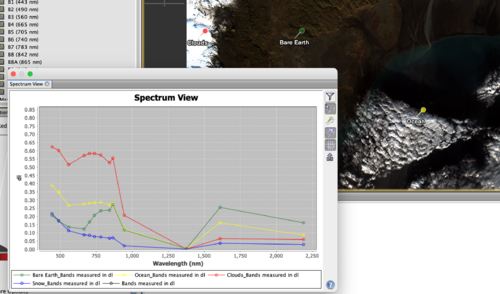
The spectrum view, found through the path Optical -> Spectrum View, shows the wavelength associated with a specific pixel as it is hovered over. It is useful in determining how different types of landcover reflect and absorb each wavelength in a given RGB composite. Figure 9 shows the popup with the spectral response of a pixel in the Natural colour composite. The icons on the right side of the pop up are:
- filter icon which allows for the customization of the spectral view popup including symbol size and shape. By clicking the down arrow near Bands measured in dl you can select which bands the graph should include and exclude, allowing for focused analysis.
- The next icon shows the spectrum at the cursor position. If this option is not already selected, press the Shift key to activate, or select this icon.
- The following two inactive icons refer to the pin manager and its capabilities, outlined below.
- the grid icon allows the user to toggle between displaying gridlines and no gridlines.
- the final icon allows for exportation of the graph data which is particularly useful with multiple pins.
Pin Manager
Pins can be added using the pin icon
to select any distinct or representative pixels in the scene. The Pin Manager is found follow the path: View -> Tool Windows -> Pin Manager. In the Pin Manager, the X, Y, Latitude, Longitude, Colour and Label are displayed in a table format with each row representing a pin (figure 10).
To change the colour of the pin, click on the colour in the corresponding pin row, several colour options will appear. Try using representative or meaningful colour associations. To edit the label of a pin, double click the cell to be edited. The right side panel holds ten icons which serve the following purposes:
- Create a new pin
- Copy and existing pin
- Edit a selected pin
- Remove a selected pin
- Import from XML file
- Export to XML file
- Filter pixel data
- Export selected data
- Zoom to selected pin
- Transfer the selected pins to other products
After pins are created, reopen the Spectrum View popup. The previously inactive icons associated with pins are now accessible. The first icon allows you to select and view a specific pin's spectrum, then compare it to other pixels by hovering or moving the cursor and noting the variation in visually similar pixels or visually distinct/exclusive pixels. The second icon graphs all pins' spectrums which also allows for separation and other landcover type analyses.
Note: deselect one icon before attempting to select another. The Spectrum Manager does not intuitively do this.
Scatter plot
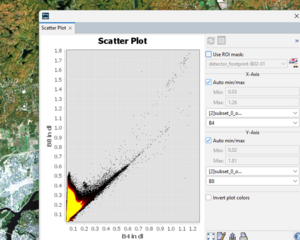
Scatter plots are an important tool in remote sensing because they allow us to visualize the relationship between two spectral bands across all pixels in an image. Unlike single-pixel spectra that show reflectance values for one location, scatter plots reveal how different land cover types cluster in two-dimensional feature space. For example, water, vegetation, and urban surfaces often form distinct groups when plotting Red vs. Near-Infrared reflectance. This makes scatter plots especially useful for identifying separability between classes, assessing band combinations for classification, and understanding which spectral features best discriminate land cover
In the Scatter Plot window: Set X-Axis Band (e.g., Band 4 – Red). Set Y-Axis Band (e.g., Band 8 – NIR). Adjust settings: Set sample size (default: random sampling from the whole image or ROI).
Optionally, define an AOI (draw a polygon or load a shapefile) to focus only on certain regions.
Common Raster Math
Mathematical calculations, such as band ratios and indices, are essential in remote sensing because raw satellite imagery alone often does not directly reveal meaningful information about the Earth's surface. By applying formulas like NDVI, NDWI, or NDBI, different land cover types—such as vegetation, water, and urban areas—can be highlighted and quantitatively analyzed. These calculations enhance the spectral differences between features, reduce noise, and allow for more accurate classification and monitoring over time.
Normalized Difference Vegetation Index (NDVI)
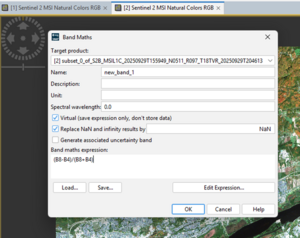
In SNAP, after subsetting your Sentinel-2 image to the study area, NDVI can be computed using the Raster → Band Maths tool. In the Band Maths window, create a new band (e.g., “NDVI”) and enter the formula:
NDVI = (B8-B4) / (B8+B4) where B8 is the near-infrared band and B4 is the red band. Once executed, a new raster layer is generated, showing values typically ranging from –1 to +1, where higher positive values indicate healthy vegetation, values near zero represent bare soil or built-up areas, and negative values correspond to water bodies
Conclusion
Working with multispectral imagery can provide insight on crop health, land cover and a host of other topics. This tutorial has given your insight into some basic to intermediary processes to explore, discuss and analyze this imagery as well as knowledge on workflows in SNAP using Sentinel data.
References
Basic Processing of Radarsat-1 data in Snap ESA
Geospatial Ecology and Remote Sensing. (2018a, March 13). Exploring Sentinel-2 multi-spectral band combinations in SNAP. https://www.youtube.com/watch?v=vtlN5MXYGaY
Geospatial Ecology and Remote Sensing. (2018b, March 13). Exploring spectral response curves from Sentinel-2 in SNAP. https://www.youtube.com/watch?v=E8Tu_IaJl6c&list=PLf6lu3bePWHCOUjTDZRNx5N07otDM8iUq&index=2
SNAP - Explore Sentinel-2 products (Old version). (2016, January 16). https://www.youtube.com/watch?v=tR_7Oq80TkA
SNAP 12.0. Release notes Sentinel Application Platform. https://step.esa.int/main/wp-content/releasenotes/SNAP/SNAP_12.0.0.html


