Off-Sea Evaluation of Unlicensed Mining Blocks in the North Sea
Contents
Introduction
Purpose
The purpose of this project is to illustrate ways to evaluate oil well suitability in the North Sea using open source GIS tools. This tutorial will demonstrate how an employee of an oil company with no GIS experience but with an interest in North Sea oil could determine the wells that are most suitable for their company to pursue. This tutorial will analyze well locations in the North Sea from the fictional/hypothetical perspective of Agip, a subsidiary of the Italian Oil company ENI, and owner of some wells in the North Sea. The tutorial will evaluate criteria related to depth of the well, port distance, whether the well is currently licensed, and environmental factors to determine suitability.
Background
This is a hypothetical situation in which we have arbitrarily chosen to imagine that AGIP oil is interested in purchasing non-licensed wells off the shore of Britain, based on four different factors. AGIP is currently a minor oil company in this region, with only 5 owned off-shore wells of the 11,239 total wells. We are imagining that AGIP requires assistance from Carleton University to develop training materials, using open source software to reduce costs. A variety of factors need to be considered to determine which wells are prime targets for each company to purchase.
The following is a list of factors used for demonstration in this study:
- Licensed or Unlicensed (Unlicensed wells are less expensive to buy the rights to mine)
- Depth of Well (Increased depth is more costly)
- Distance from London (Main Shipping Center)
- Environmental Concerns (Areas outside environmental protection polygons are more desirable)
Methods
Software Preparation
If you don't already have it, download Quantuam GIS from QGIS.org The most recent version of QGIS is Zanzibar 3.8.3, which is available for Windows, Linux, MacOS X, Android and numerous other operating systems. This walk-through uses Windows for the duration of the analysis.
Data Collection
To do a proper analysis data is needed on the area and all of the constraints involved. We used data from the Internet and some data we created ourselves. Data and corresponding source sites are listed below.
| Data Type | Data Format | Data Source/Info |
|---|---|---|
| Coastline of United Kingdom | Vector Polygon | European Environment Agency Layer: Low-resolution coastline of Europe, June, 2016. |
| Water Bodies | Vector Polygon | Marineregions.org Layer: Water bodies of the world (including the North Sea). 2018. |
| Wells w/ license information | Vector Polygon | Oil and Gas Authority Layer: Surface locations of all UK onshore and offshore wells with license information. September, 2019. |
| Wells w/ water depth information | Vector Polygon | Oil and Gas Authority Layer: Locations of all UK offshore wells with water depth information. October, 2019. |
All of the above files are to be downloaded and extracted to a single folder. You can add these shapefiles to the map by clicking on the "Open data source manager" tool located on the data source manager toolbox near the top of the QGIS interface. The oil well data will be in polygon form. You will want to convert these oil well polygons into vector points. This can be done by going to vector->geometry tools->centroids. Select the oil well file as the input layer, and click run. A new layer will be created with vectors points representing the location of the oil wells.
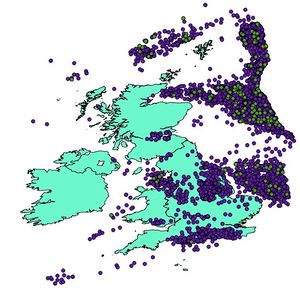
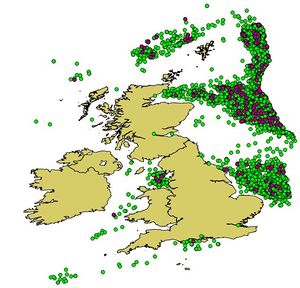
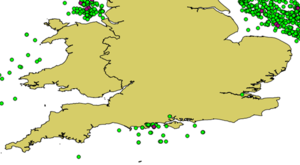
Figure 1: The original data files upon addition to QGIS. The green wells are a file which ultimately was not used in the study
Data Preparation
Data Join
The first thing you will want to do to prepare the data is to perform a data join between the two oil well shapefiles, so that the attributes from both are all available in one place. In this data join you will be bringing the water depth data from the water depth shapefile to the oil well shapefile that contains information on whether the oil is licensed or unlicensed. A data join can be done through the layer properties menu on either of the oil well layers property menus. Depending on which layer you use you will be joining either the water depth information, or license status information. The end product you want from this data join is a layer that possesses both information on license status and water depth.
Difference Tool
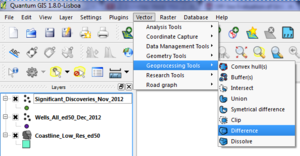
The Wells file contains points that are both on-shore and off-shore. Since Agip oil is only interested in off-shore wells the data must be separated. Using the Geoprocessing Tool called Difference located within the Vector tab at the top of the QGIS console allowed the on-shore wells to be removed from the study.
Figure 2: This is how to navigate to the Difference Tool in QGIS
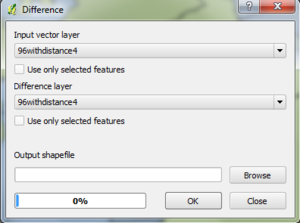
Figure 3: The Difference tool
The difference tool is used to extract features from the input layer that don't fall within the boundaries of the overlay layer. We want to extract the onshore oil wells from the oil well shapefile, leaving only the offshore oil wells on the oil well layer.
For the input layer you will select the oil well layer, and for the overlay layer you will select the world seas layer. Once those layers are selected you can hit "run" and the difference tool will run its function. Once the tool is finished running the oil well layer should only have offshore oil wells remaining.
Figure 4: The off-shore wells after the on-shore wells have been removed
Creating the Licensed or Unlicensed Well Constraint
Unowned wells are less expensive to buy the rights from other companies. There are several ways in which you can separate unlicensed oil wells from licensed oil wells. The first of which is simply through selecting the vector points that are unlicensed. To do this first click once on the oil well shapefile in the layers menu, and then click on the "select features by value" tool in the top toolbox. To select all unlicensed oil wells, type "No" beside the "LICENSED" feature, then click select features. Once this is done only the unlicensed oil wells will be highlighted on the map. You can also click on "zoom to features" to pan to the selected features.
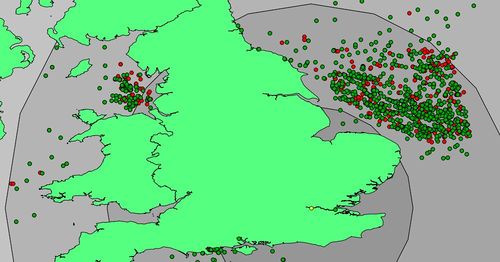
Below is a map similar to the one previously. The red points are licensed wells and green points are unlicensed wells.
Figure 5: Screenshot of unlicensed wells (green) and the original (red)(there are red dots under green dots)
Creating a new layer (optional): You may want to create a new layer that features only the unlicensed oil wells. This can be done by right clicking the oil well layer, then go to "export" and then click on "Save selected features as..." (the features must already be selected to do this). This will take you to a window where you determine your coordinate system, file name and location. Leave the "Add saved file to map" option checked off. Once that is done you can click OK and the new layer will be added to the map.
Creating the Depth of Well Constraint
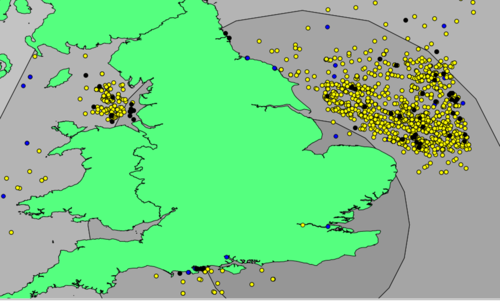
The deeper the well the more expensive the drilling operation. Thus wells in shallower depths will be considered optimal. Below is an image of the some of the wells around Southern Great Britain, the yellow wells are less than 500m depth and the black points are less than 50m depth.
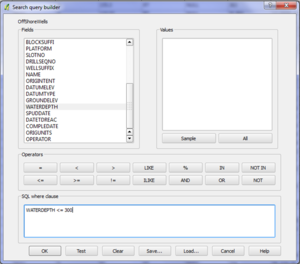
Figure 6: Advanced query builder in QGIS to find wells with depths under 50m from the 'waterdepth' field
Figure 7: A view of the off-shore wells after various depth analysis were performed
Creating the Distance Constraint
Create a new Shapefile (point) called London.To make a London shapefile you can click on the “layer” dropdown menu at the top of the screen, then click on “create layer->new shapefile layer”. This will bring you to a menu where you specify the file name/location, the geometry type (point), the coordinate system (EPSG: 4326 - WGS 84), and field name (one field named “City” is sufficient for this demonstration). Once those are selected, you can click OK and a new vector point layer will be created. To add a new point you will have to first toggle editing for the new made layer, then click “add point features”. To enter the actual coordinate location of London you can type the coordinates (51.5074° N, 0.1278° W) in the coordinate bar at the bottom of QGIS and hit enter once typed in. This will take you to the exact location. (Note: the QGIS coordinate bar uses longitude first, and latitude second). Once the location of the London vector point is placed correctly you can hit save.
Another method of placing the London vector point is to approximate the location. Below is a step-by-step zooming on the approximately correct placement of a London point file.
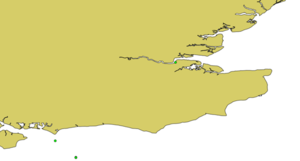
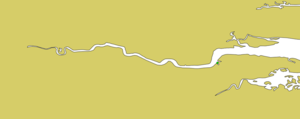
Figure 8: A step-by-step view of the zoom in to the correct location of the the London shipping point
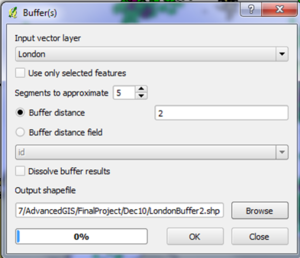
- This allows for a distance buffer to accommodate transportation costs (ship, pipeline, vehicle)
Figure 9: The Buffer tool inside QGIS
- Buffer of 2 degrees of longitude/latitude
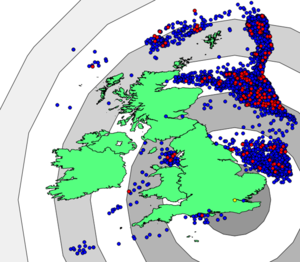
Figure 10: A screenshot of the buffer rings spreading from the shipping center (London)
All the buffer files need to have difference analysis performed on them, because none of them are donuts. the below figure shows the distance buffers with the donut effect performed on them. Every second donut has been removed to easily see the donut effect.
Figure 11: A screenshot of the donut buffer rings spreading from the shipping center (London)
Creating the Environmental Concerns Constraint
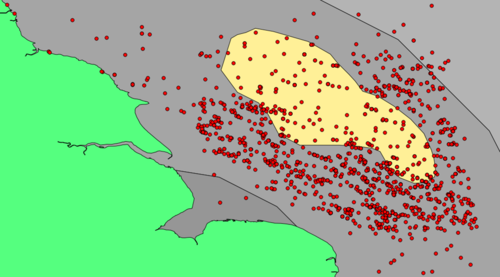
A polygon file was created in the southern section of the North Sea. This polygon represented a fictitious environmental constraint. This artificial constraint will be a whale breeding zone. Areas outside environmental polygons are more desirable because of the increased risk involved in damaging or disrupting the whale breeding ground by either too much activity or oil spills.
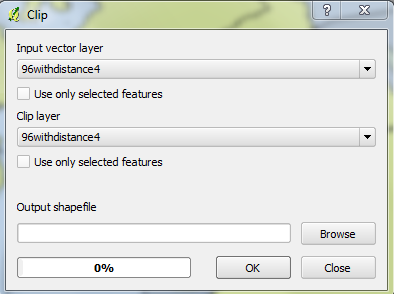
Figure 12: Clip tool within QGIS
Figure 13: The Environmental constraint region (Whale Breeding Grounds)
Results
Elimination Process
Each of the 11,239 wells went through 4 different constraints to determine which were suitable and which wells were not suitable.
- Low Water Depth (Under 50m)
- No current ownership
- Close to processing Plants (London)
- Outside the Environmental Region
Optimal Well Selection
In this step the 11,000 wells were trimmed down based on undesirable attributes. The ideal characteristics are listed below:
Order of Well Elimination:
- Unowned Wells
- Well depth less than 50m
- Less than 4 degrees of longitude/latidude from London
- Outside the Whale Breeding Zone
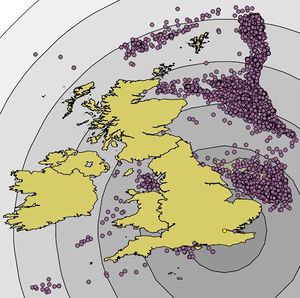
The Removal of Licensed Wells dropped the total number of wells from 11239 down to 6090 (54.2% of original). The unlicensed wells can be seen below in purple.
Figure 14: Remaining wells after removal of licensed wells
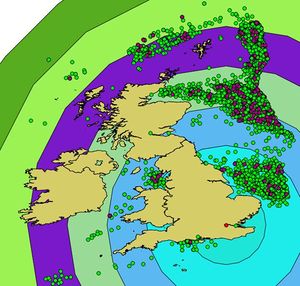
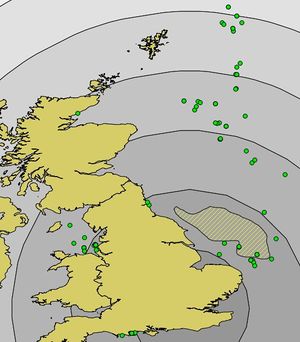
Depth of Well Elimination dropped the total number of wells from 6090 down to 96 (0.85% of original). The remaining wells can be seen below in green.
Figure 15: Remaining wells after removal of wells with depths greater than 50m
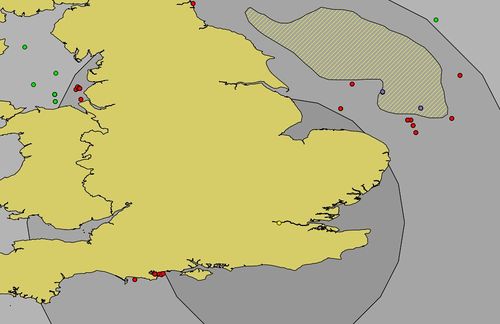
Distance of 4 degrees of longitude/latitude and the removal of a couple of the wells inside the whale breeding zone (Environmental Region) reduced the number of wells from 96 down to 37 (0.33% of original). In the image below the green dots are wells that did not pass the distance test. The two purple dots were found within the region of whale breeding thus were eliminated and leaving the 37 red dots as the finalists.
Figure 16: The green coloured wells did not pass the distance constraint (4 degrees of lat/long). The purple colored wells did not pass the environmental constraint. The red wells are the final wells in the study which passed all the constraints.
Conclusion
This tutorial provides a lesson on some of the tools used in determining suitability of oil wells using Quantum GIS. Our study analyzed oil wells in the North Sea taking into considering water depth, ownership, proximity to processing centers and environmental constraints to determine the wells that were most suitable for purchase by Agip Oil.
Our final results are shown in figure 16; the red dots represent the 37 wells that we recommend Agip pursue, the purple dots violate the environmental constraint, and the green dots violate the distance proximity requirement. Of course these results could be modified if there is a change in variables such as the environmental constraint, or if a company had a different port in mind they could create a point for the new port and determine the new distances.
We found Quantum to be very good overall. The only real problem we encountered occurred when we were using the “difference” function. It had a tendency to freeze the computer part way through the process, forcing us to restart it. All the other functions worked well and were very intuitive
