Off-Sea Evaluation of Unlicensed Mining Blocks in the North Sea
Contents
- 1 Introduction
- 2 Methods
- 2.1 Software Preparation
- 2.2 Data Collection
- 2.3 Data Preparation
- 2.4 Creating the Distance Constraint
- 2.5 Creating the Depth of Well Constraint
- 2.6 Creating the Licensed or Unlicensed Well Constraint
- 2.7 Creating the Environmental Concerns Constraint
- 2.8 Creating the Significant Discoveries Constraint
- 2.9 Optimal Well Selection
- 3 Results
Introduction
Purpose
The purpose of this project is to develop a way to evaluate oil well suitability in the North Sea. This tutorial will demonstrate how an employee of an oil company with no GIS experience but with an interest in North Sea oil could determine the wells that are most suitable for their company to pursue. This tutorial will analyze well locations in the North Sea from the perspective of Agip, a subsidiary of the Italian Oil company ENI, and owner of some wells in the North Sea. The tutorial will evaluate criteria related to depth, port distance, proximity to other company owned wells, and environmental factors to determine suitability.
Background
This is a hypothetical situation in which AGIP oil is interested purchasing licensed or non-licensed wells off-shore Britain. AGIP is a minor oil company with only 4 owned off-shore wells of the 11,239 wells. Additionally, they do not currently own the right to any of the newly labelled significant wells. AGIP requires assistance from Carleton University using open source software to reduce costs. A variety of factors need to be considered to determine which wells are prime targets for each company to purchase.
The following is a list of factors used in this study:
- Distance from London (Main Shipping Center)
- Depth of Well (Increased Depth is more costly)
- Licensed or Unlicensed (Unowned wells are less expensive to buy the rights from)
- Environmental Concerns (Areas outside enviromental polygons are more desirable)
- Significant Discoveries (Significant wells are more financially rewarding than regular wells)
Methods
Software Preparation
Download Quantuam GIS from QGIS.org The most recent version of QGIS is Lisboa 1.7 which is available in Windows, Linux, MacOS X, Android and numerous other formats. This walk-through uses Windows for the duration of the analysis.
Data Collection
To do a proper analysis data is needed on the area and all of the constraints involved. We used data from the internet and data we created ourselves. Data and corresponding source sites are listed below.
| Data Type | Data Format | Data Source/Info |
|---|---|---|
| Coastline of United Kingdom | Vector Polygon | Department of Energy and Climate Change Layer: low-resolution coastline of mainland Britain, December, 2012. |
| Significant Discoveries | Vector Polygon | Department of Energy and Climate Change Layer: discoveries identified by DECC as "significant" in terms of flow rate. Does not indicate commercial potential, but identifies those with an approved or in-production field development plan, December, 2012. |
| Wells | Vector Polygon | Department of Energy and Climate Change Layer: surface locations of all UK onshore and offshore wells. December, 2012 |
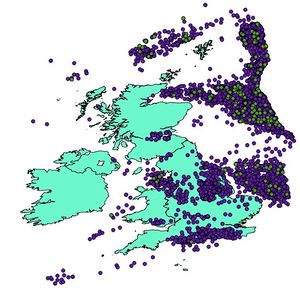
All of the above files are to be downloaded and extracted to a single folder. Once added into QGIS using the Add Vector Layers tab the data should look the same as below (ignoring the colours).
Data Preparation
- Various layers needed to clipped so that were relevant to the study.
The Wells file contains points that are both on-shore and off-shore. Using the Geoproccesing Tool called Difference located within the Vector tab at the top of the QGIS console allowed the on-shoe wells to be removed from the study. None of the Significant Discoveries points are located within the bounds of the coastline file, thus no difference analysis was needed.
Creating the Distance Constraint
Create a new Shapefile (point) called London. Place the new point file in the approximately correct position.
- This allows for a distance buffer to accommodate transportation costs (ship, pipeline, vehicle)
- Buffer of 2 degrees of longitude/latitude
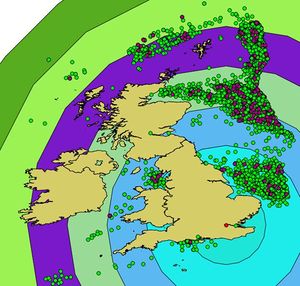
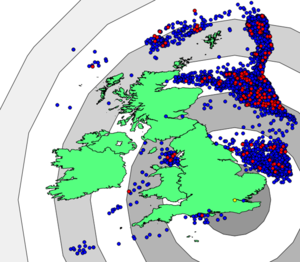
All the buffer files need to have difference analysis performed on them, because none of them are donuts. the below figure shows the distance buffers with the donut effect performed on them. Every second donut has been removed to easily see the donut effect.
- This step will be expanded and detailed in a future version of the wiki
Creating the Depth of Well Constraint
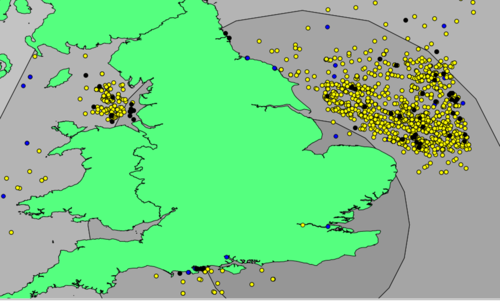
The deeper the well the more expensive the drilling operation. Thus wells in shallower depths will be considered optimal. Below is an image of the some of the wells around Southern Great Britain, the yellow wells are less than 500m depth and the black points are less than 50m depth.
Creating the Licensed or Unlicensed Well Constraint
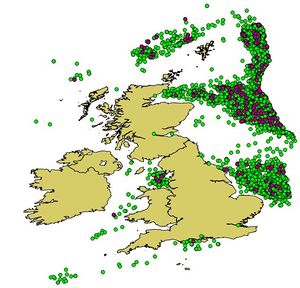
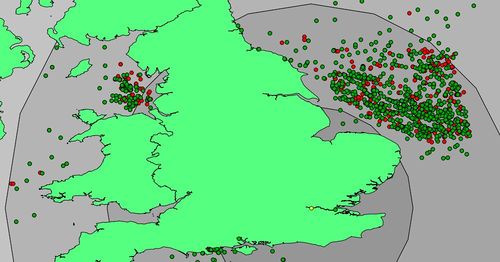
Unowned wells are less expensive to buy the rights from other companies. Below is a map similar to the one previously. The red points are licensed wells and green points are unlicensed wells.
Creating the Environmental Concerns Constraint
Areas outside enviromental polygons are more desirable
Creating the Significant Discoveries Constraint
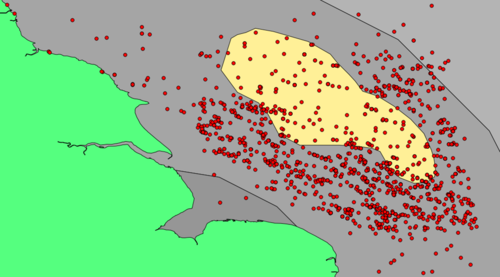
Significant wells are more financially rewarding than regular wells
Optimal Well Selection
Results
Ideal Well has the following characteristics
- Close to processing Plants
- Low Water Depth
- No current ownership
